

Dr. Corsi received his PhD in Population and Public Health in 2012 from McMaster University. He completed his postdoctoral training at the Harvard Center for Population and Development Studies in 2014, where he specialized in innovative methods to understand the influence of socioeconomic status on health and a focus on substance use epidemiology. He is a Scientist with the CHEO Research Institute and an Assistant Professor at the University of Ottawa.
Dr. Lippert received his PhD in Demography and Sociology in 2013 from the Pennsylvania State University. He completed his postdoctoral training at the Harvard Center for Population and Development Studies in 2015, specializing in population health science and geospatial methods. He is an Associate Professor of Sociology at the University of Colorado in Denver.
A grant from the Canadian Institutes for Health Research funded this work. We want to thank Malia Murphy, Serine Ramlawi, and members of the OMNI Research Group (https://omni.ohri.ca/) for their assistance with grant preparation. We also thank The Ottawa-Outaouais Research Data Centre for providing access to the Statistics Canada microdata.
Community-level data is crucial to nicotine surveillance and efforts to lower tobacco consumption, but the availability of such data across Canada is lacking. National surveys of substance use cannot reach all communities, and those that are included may be represented by only a few individual survey respondents. This problem leads to a question: how can reliable community-level estimates of nicotine use be generated from data with sparse community sampling?
Addressing this challenge lies at the centre of this project. We drew on data from ten nationally-representative surveys of nicotine use – including electronic nicotine delivery systems (ENDS) – in Canada across four survey platforms conducted between 2013 and 2021. These surveys include over 225,000 respondents from nearly 300 communities in all 13 provinces and territories (“Provinces”). Using the combined data, we derived empirical estimates of community-level smoking and “vaping” with techniques to correct for the imprecision of community-specific estimates in sparsely-sampled communities. The resulting empirically-estimated data provide insights on the geography of nicotine and ENDS use, the communities where such use is most common, and the range of policy responses that our findings recommend. We pay particular attention to ENDS use as these technologically novel devices constitute the fastest-growing method of nicotine use in Canada.
In the following sections, we illustrate these findings with a library of graphics and maps and discuss the community correlates of electronic cigarette use.
Electronic nicotine delivery systems (ENDS) are a broad class of devices used to heat and vaporize a liquid solution, delivering an inhalable aerosol to users. Because the solutions often contain nicotine, these devices are popularly referred to as electronic cigarettes or “e-cigs.” Using an ENDS device is often called vaping as opposed to smoking due to the aerosolized vapour delivered to the user. These terms will be used throughout this report.
Vaping has become increasingly popular since e-cigarettes were first introduced to North American markets in 2004 in Canada and in 2007 in the United States.1,2 The first modern electronic cigarette – Ruyan – was developed by Chinese pharmacist Hon Lik and released in China in 2003. However, the technology to generate nicotine aerosol from a liquid solution was first explored in the early 1990s by various companies including Philip Morris.3 Data from the 2020 Canadian Tobacco and Nicotine Survey (CTNS) reveal that 35% of teens aged 15-19 and 43% of young adults aged 20-24 had vaped in their lifetimes; 14% and 13% reported past-month vaping, respectively.4 These figures represent a considerable rise in e-cigarette use over time. Comparable estimates from the 2013 Canadian Tobacco, Alcohol, and Drugs Survey (CTADS) – the survey replaced by the CTNS – showed that lifetime and past-month use among teens was 19.8% and 2.6%, and 20.1% and 3.9% among 20-24-year-olds, respectively.5 The trend of rising ENDS use is concerning because e-cigarette use among younger people is associated with higher odds of future cigarette smoking.6
Risks associated with vaping are not isolated to the initiation of conventional smoking. Emerging evidence has shown there are direct risks, too. E-cigarette aerosols contain compounds that are carcinogenic and damaging to pulmonary health. These include heavy metals, aldehydes, and nitrosamines7 – compounds associated with DNA and cellular damage, oxidative stress, and respiratory impairments.8,9
An ENDS user holds a discrete USB-sized vaping device
Other adverse outcomes associated with ENDS use include damage to teeth and gums,10 impaired neurological development,11 and heightened vulnerability to infectious diseases.12
As the scientific community continues to elucidate the physiological risks of vaping, policy responses have lagged behind the proliferation of novel ENDS technologies and product development. By 2007, commercially viable ENDS devices were widely available across North America and Europe. However, tobacco companies and inventors, including Herbert A. Gilbert, had begun exploring the possibility of smokeless devices that would heat but not burn tobacco as well as tobacco alternatives in the 1960s, hoping to develop “safer” or more “socially acceptable” products.13 The term “vape” was coined in 1979 by physician Norman Jacobson and engineer Phil Ray, founder of Computer Terminal Corporation – a company that pioneered the development of the first desktop computers. Jacobson long sought a safer alternative to conventional smoking, and while his “non-combustible cigarette” was a commercial failure, it provided the blueprint for next-gen ENDS devices. One such device arrived in 2003 when Hon Lik filed patents on three continents for his invention, serving as the template for most modern e-cigarettes today. Commercial production of Lik’s device began in 2004, and sales of the Ruyan e-cigarette began shortly after that. In 2013, Philip Morris launched the MarkTen e-cigarette, which the company had been developing since 1990.3
The evolution of ENDS devices and accessories continues to the day. While first-gen devices were relatively simple pen-like apparatuses designed to mimic “analog” cigarettes in appearance, consumers now have many more options. These range from disposable options – the leading choice for teenage users14 – that are more characteristic of the earliest products to ornate reusable options replete with LED lights, decorative features, and other cosmetic distinctions that appeal to the status-conscious user.15 The choice of which device to use has consequences for the user’s health. Larger and more expensive units often have more powerful internal heating elements powered by higher-voltage batteries that vaporize liquid nicotine solutions at higher temperatures, releasing more toxins such as aldehydes and acetones than lower-powered alternatives.16
The most modern incarnations of ENDS devices favour discretion, with diminutive options that can be used clandestinely in environments where vaping is prohibited, like public spaces, at home, and in school. This particular innovation correlates with a spike in use among adolescents and young adults after 2015 when the first Juul devices – measuring less than 100mm – were available for purchase.17,18
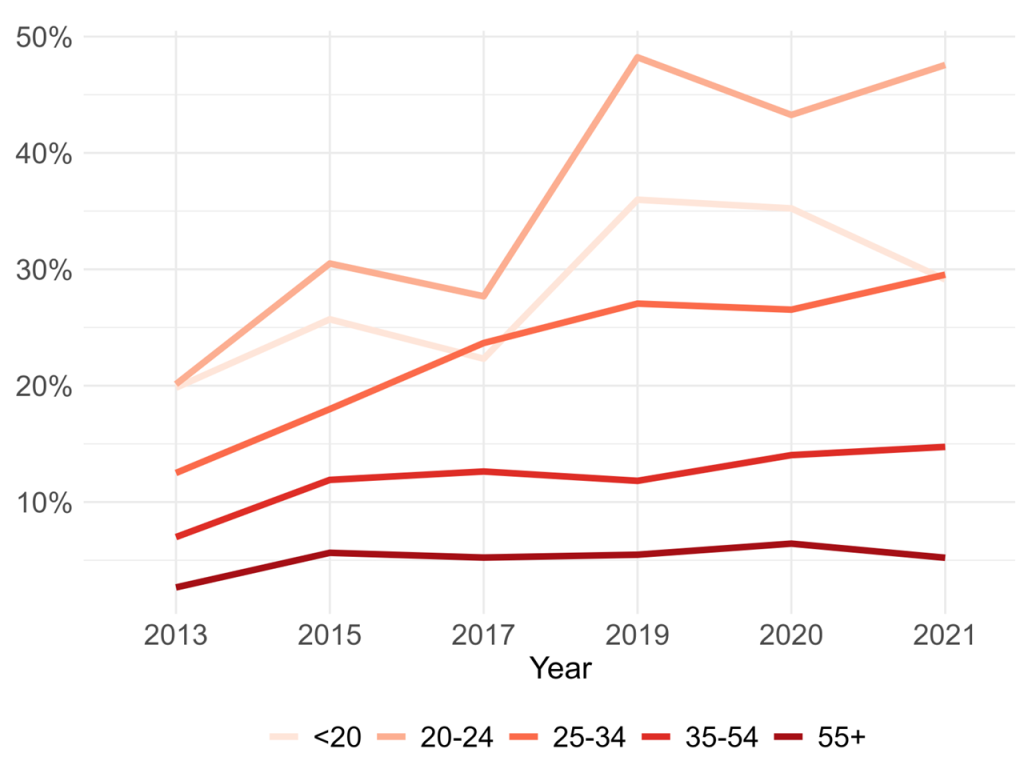
Age-specific prevalence of lifetime ENDS use, CCHS CTADS
Trends in ENDS Use, Canada 2013-2021
An instant hit with teenage users, “juuling” quickly entered the ENDS lexicon15 as a verb denoting both a specific brand and the health behaviour its products enable.
Among the most consequential ENDS innovations is the proliferation of flavoured nicotine cartridges, pods, and e-liquids with teen appeal. In the US, nearly 85% of adolescent and young adult ENDS users report using flavoured e-cigarettes16; among the most popular flavours reported in the 2022 National Youth Tobacco Survey were fruit flavours (69%) followed by candy or dessert flavours (38%). Several studies have found that flavoured e-cigarette products are marketed using packaging and language that resonates specifically with youthful consumers – especially minors.19 In addition, e-cigarette marketing also engages youth through television, video, and other electronic platforms and social media advertisements.20
Flavoured vaping products have drawn the ire of federal and regional governments in Canada and the US. However, the legislation to control these products has been slower to come into force. In Canada, flavouring and sweeteners have been banned from conventional cigarettes and cigarette products across all Canadian provinces since a 2009 amendment to the Tobacco Act, and later expanded in 2015 to restrict menthol additives.21 Similarly, in the US, the 2009 Family Smoking Prevention and Tobacco Control Act bans flavoured cigarettes in addition to making the selling of tobacco products to minors, tobacco-brand sports sponsorships, entertainment events or other social or cultural events and free giveaways of sample cigarettes or brand-name promotional items illegal. However, this legislation does not extend to vaping products.22 In Canada, the Tobacco and Vaping Products Act sets a minimum age of 18 for the legal sale of vaping products, places restrictions on advertisements, health warnings, and maximum nicotine content (20 mg/ml since 2021), but stops short of controlling non-tobacco flavours. In select Provinces, including Quebec, New Brunswick, Nova Scotia, Prince Edward Island, Northwest Territories, and Nunavut, any e-cigarette liquid other than tobacco flavour is prohibited (see Appendix A for federal and provincial regulations on ENDS products). National policy around e-cigarette flavourings is still in development in the US. The Food and Drug Administration (FDA) holds authorization for e-cigarette sales in the US, and since 2021, the agency has been limiting sales authorization to tobacco-flavoured products only. In 2022, the FDA issued marketing denial orders to Juul for the company to stop selling and distributing all Juul devices and pods. Furthermore, a recent landmark court case filed by 33 states and Puerto Rico led to a $440 million settlement against the makers of the minuscule Juul devices for sparking a national surge in teen vaping.23
Ecological factors have also been identified as potential risks for e-cigarette use. Among school-aged populations, attending schools with permissive cultural norms vis-à-vis nicotine use and rich networks of classmates who vape is associated with a higher likelihood of e-cigarette use net of personal risk factors, including co-residence with cigarette smokers or ENDS users 28. Moreover, school-level influences on teen vaping appear to grow in importance with the introduction of novel vaping technologies 29, which includes the discrete Juul devices – an adolescent fan-favourite since their introduction to the Canadian market in 2018. At the neighbourhood level, e-cigarette retailer density is linked to community racial and ethnic composition, with retailers congregating in areas predominated by non-white ethnic minorities.30
While extant research highlights the relevance of ecological factors to community-mediated ENDS availability and use, gaps exist in the current data infrastructure that limits ecological studies of e-cigarette use and its community correlates. The reason for this stems from practical matters inherent to nearly all observational studies. In large national surveys, compromises must be made to collect data representative of all of Canada, if not each community represented in a given study. Consequently, many communities may only be represented by a few survey respondents, hindering the ability to generate reliable community-level estimates of nicotine and ENDS use. Here, we introduce a technique known as precision-weighted estimation (PWE)31 as a way to remedy this problem and to measure and evaluate the prevalence of vaping across the geographic level of Census Divisions in Canada.
This research aimed to generate a publicly-available dataset of empirically derived estimates of nicotine and ENDS use. We achieved this by estimating a series of multilevel regression models using PWE to correct empirical estimates for imprecision. This process unfolds over several steps:
We first merged restricted-use data from ten national surveys conducted between 2013 and 2021 on 225,991 respondents, preserving geographic identifiers of all participants’ Province and Census Division of residence.
We then estimated random-intercepts multilevel regression models of multiple nicotine and ENDS use outcomes, adjusting for survey type, year, and respondent age and sex (Equation 1).
Adjusted estimates of community-level (Province or Census Division) nicotine and ENDS use are retained from the multilevel models.
PWE is then applied to these estimates via a “shrinkage” estimator that attenuates the least precise estimates toward the grand mean of the full sample following Equation 2. 32 In this equation, the shrinkage estimator is given by multiplying a community-specific residual (r_{j}) by the ratio of a community-level variance component (\sigma_{u0}^{2} ) and the total variance of the estimate ( \sigma_{u0}^{2} + \sigma_{e0}^{2}) adjusted for each community-specific sample size (n_{j} ). Intuitively, this attenuates – or shrinks – the empirical estimates of all outcomes towards the grand mean in the sample, particularly for communities that provided relatively few survey respondents.
y_{ij} = \beta _0 + \beta_1x_{1ij} + (u_{0j} + e_{0ij})
û_{0j} = r_j \times \frac{\sigma ^2_{u0}}{\sigma^2_{u0} + \sigma^2_{e0}/n_j}
We concatenated our ten survey datasets into a single analytical file using standardized coding for each census-defined geography (Province and Census Division) and survey-year identifiers. Each survey – described below – involved participants aged 12 years and older, with one exception. Sub-populations of interest for estimates of nicotine and ENDS use rates across both levels of geography included: conventional cigarette smokers, females and males, and younger people, including adolescents under the age of 20 and young adults (20-24 years old).
The CTADS is an ongoing nationally representative (with the exclusion of the territories) telephone-based survey that monitors the use of tobacco, e-cigarettes, alcohol, and drugs across the Canadian population. The biennial survey is available from 2013 until 2017. CTADS targets all Canadians aged 15 years and older living in Canadian provinces, with an average response rate of 77.1%. The sample sizes in 2013-2017 varied between 14,565 and 16,349 respondents. CTADS asks respondents about various aspects of ENDS use, including the source of e-cigarettes, use of ENDS for smoking cessation, harm perception, and reason for initiating ENDS use.
In 2019, CTADS was revised such that it is now conducted as two new independent surveys: The Canadian Tobacco and Nicotine Survey (CTNS) and Canadian Alcohol and Drug Survey (CADS).
Canadian Tobacco and Nicotine Survey (CTNS):
The CTNS sample survey collects data primarily on tobacco and nicotine use. The target population is individuals aged 15 years or older living in one of 10 Canadian provinces. Individuals who are members of collectives, living on reserves, or institutionalized were excluded from this survey.
Approximately 8,614 respondents aged 15 or older completed the survey in 2019, whereas 8,112 respondents completed the 2020 survey and 9,908 in 2021. The survey collects data on cigarette smoking, use of tobacco products, vaping as well as alcohol and cannabis use.
Canadian Alcohol and Drugs Survey (CADS):
The CADS is administered to all Canadian individuals 15 years or older. Individuals residing in any of the 3 Canadian territories, institutionalized individuals or residents on First Nations reserves are excluded from participating in this survey. In 2019, 10,293 respondents answered questions about alcohol consumption, alcohol-impaired driving, cannabis use, psychoactive pharmaceutical drugs, and illicit drugs. The CADS captures information on alcohol use in pregnancy from individuals with pregnancy within the last 5 years.
Canadian Community Health Survey (CCHS):
The CCHS is a large-scale annual health survey that covers a range of topics, including detailed questions on smoking, e-cigarettes (since 2015), and was designed to provide data on health indicators at sub-provincial levels. An advantage of the CCHS is the large sample size which permits analyses at even smaller levels of geography, for example, census DA, than are possible with the CTADS. The CCHS targets all Canadians aged 12 years and older, and the sample size is approximately 65,000 respondents annually. Individuals not captured by CCHS are those living on Indigenous Reserves or Crown Land, institutional residents, full-time members of the Canadian Forces, and residents in certain remote regions. The sample design provides reliable estimates at the sub-provincial level with a multi-stage sampling allocation strategy to give relatively equal importance to all regions and provinces.33 The CCHS asks respondents if they are currently pregnant, their pregnancy history in the past five years, and past-month days ENDS use.
Restricted-use versions of each data source include postal code identifiers, which allow mapping to the standard Census Geographics at the Provincial and sub-Provincial levels. We use the Postal Code Conversion File (PCCF), originally developed by Statistics Canada34 and an associated SAS program to map respondent six-digit postal codes to Census Dissemination Areas (DA). Individuals are assigned to their DA of residence using the program, and the corresponding Census Division can be identified. The PCCF uses probabilistic assignment if a DA overlaps multiple postal codes.
The lowest level of aggregation used in this analysis was the Census Division to ensure the privacy of survey respondents and comply with the survey-specific rules for data aggregation and release. Census Divisions are second-level geographies in Canada, one level below the Provinces.35 Census Divisions are primarily used for statistical and data presentation. However, in certain provinces, including British Columbia, Nova Scotia, New Brunswick, Ontario, and others, Census Divisions correspond to regional divisions or historic counties. In other areas, Census Divisions correspond to groupings of urban or rural municipalities. Previous research has demonstrated that health outcomes vary across Census Divisions,36 highlighting their importance for monitoring area-based inequalities in health outcomes and risk factors.
The databases required to carry out this study exist at Statistics Canada and were accessed via the Canadian Research Data Centre Network (CRDCN), and the Ottawa-Outaouais Research Data Centre (ORDC).
Area-level primary outcomes include the percentage of the [Provincial/Census Division] population reporting lifetime and past-month ENDS use and conventional cigarette smoking. These outcomes were estimated for all ten Provinces in Canada (and, where available, 3 territories) and 293 Census Divisions. Because past-month use is frequently used as an indicator of current or active use, we focused our analysis on past-month nicotine and e-cigarette use. We estimated use rates for these geographies for the entire concatenated sample and separately by age and sex/gender. In addition to adjustments for the data source and survey year, estimates for the full sample are corrected for differential propensities for survey participation by age and sex/gender – demographic traits related to ENDS use and smoking. All analyses to derive empirical estimates of smoking and vaping incorporate survey weights provided with the individual survey files. These were adjusted when pooling across surveys and for use in multilevel models.37,38
Drawing upon the 2016 Canadian Census, we relate several census division-level correlates to e-cigarette use rates. These indicators were calculated from the 2016 census master file aggregated to the level of census divisions. They include median age, percentage visible minority, composition by indigenous status, aggregate education (i.e., percent with a four-year college degree), median income, proportion low income (based on an after-tax low-income measure), proportion unemployed (among the population aged 15-years and over), female labour opportunity index, and the index of concentration at the extremes (ICE), which quantifies the extent to which individuals are in the top income quintile versus the bottom.39 Visible minority is defined as non-Caucasian individuals, including Chinese, Black, South Asian, Southeast Asian, Latin American, Arab, other or multiple visible minorities. Indigenous people are defined as individuals with First Nations, Metis, or Inuit identities. The female labour opportunity index is the ratio of females to males in ‘white collar’ occupations defined in the NOC 2016.
We also examined the following provincial policies related to e-cigarettes, which fit broadly into six categories: i) price and taxation, ii) retail sale, iii) controls on product flavouring, iv) advertising, v) places that prohibit the use of ENDS products, and vi) places that prohibit the sale of ENDS products. Price and taxation include the imposition of financial charges by provincial governments on individuals, manufacturers or retailers on sales of e-cigarettes and ENDS products. These fees may be added to vaping products as a tax or as a fee applied to manufacturers or retailers. Retail sales policies include regulations placed on the sale and promotion of ENDS products in stores and on the internet to restrict the exposure and availability of ENDS products to youth. This is assessed through the age restrictions placed on the sale of ENDS products, where they may be sold and how they are allowed to be displayed and promoted in these stores.
Controls on ENDS Product Flavoring: the provincial restrictions placed on the sale of flavoured ENDS products are a potential solution to reducing ENDS initiation and limiting a potential driver of combustible tobacco use in youth.40,41 We examine this through the restrictions on ENDS product flavours allowed for sale in the province and the location of sale permitted for any flavoured ENDS products allowed.
Advertising includes provincial restrictions placed on public advertisement of ENDS products for retailers and manufacturers. Constrictiveness of public advertising of ENDS products is assessed through bans on outdoor signage, lifestyle ads, sponsorships, and youth-appealing ads.
Places that Prohibit the Use of ENDS Products: The limitations implemented by the provincial governments on the areas where e-cigarette products are permitted. Provinces aim to reduce ENDS product use and encourage vaping cessation in their populations by restricting the availability of areas where ENDS products are allowed to be used. These restrictions allow fewer opportunities for people to smoke together or alone in public, lowering the visibility of people who smoke and decreasing its social accessibility.42 Restrictiveness is assessed through the number of places (including healthcare facilities, childcare facilities, school properties, post-secondary campuses, workplaces, indoor public places, patios, public transit/vehicles, private vehicles with minors, playgrounds, outdoor recreational facilities, outdoor cultural events, parts of provincial parks and public beaches) that prohibit the use of ENDS products.
Places Where the Sale of ENDS Products is Prohibited: Another dimension layer of the control of sale is the limitations implemented by the provincial governments on the places permitted to sell ENDS products. Places prohibited from selling ENDS products cannot sell these products as retailers nor register to become specialty vape stores. Such places include non-specialty vape stores, hospitals/health care facilities, long-term care facilities, pharmacies, post-secondary campuses, schools, childcare settings, vending machines, government buildings, amusement parks/arcades, theatres, recreation centers, libraries and cultural centers, casinos, temporary facilities and the internet.
The following section summarizes our findings in a series of descriptive data visualizations. These include graphs that depict the concordance between smoking and vaping rates across Provinces, ENDS use between women and men, and differences by age. We rely extensively on mapping to illustrate the geographic dispersion of high and low smoking and vaping rates across Provinces and Census Divisions, and we employ spatially explicit correlational analysis using Lee’s L statistic43, which is given by the following formula:
L_{X,Y} = \frac{\sum _i[(\sum _jw_{ij}(x_j – \overline{x}))\cdot(\sum _jw_{ij}(y_j-\overline{y}))]}{\sqrt{\sum _i(x_i-\overline{x})^2}\sqrt{\sum _i(y_i-\overline{y})^2}}
where wij is a row-standardized spatial weight for every ith Census Division in each jth network of nearby Census Divisions. This equation is essentially an amalgam of Pearson’s r and Moran’s I statistics to produce LX,Y – a measure of both bivariate correlation and spatial autocorrelation ranging from -1 (indicating an inverse relationship between two variables) to +1 (indicating a positive relationship).
Spatial analyses were conducted in RStudio, using packages for cartography and mapping, assessing geographic clustering of outcome measures, and examining correlations among community factors and nicotine-use outcomes while adjusting for the spatial structure of the outcomes under investigation.
To assess the presence of provincial polices, we summed the number of restrictions in place at a provincial level as of July 2023, within each of the six identified policy domains. We also calculated an overall policy score based on the total number of restrictions at a provincial level and ranked provinces by the total scores, with higher ranks given to locations with more policy controls on ENDS products in place.
It is of utmost importance that the identity and privacy of the population, particularly marginalized groups, be protected. Throughout all analyses, small cell sizes that may pose a risk to identification and privacy were suppressed or merged with neighbouring units to meet the confidentiality requirements of the Statistical Act.
We begin by taking a wide-angle view of smoking and ENDS use at the Provincial level. For the sake of parsimony, we include the Territories in our definition of a “province.”
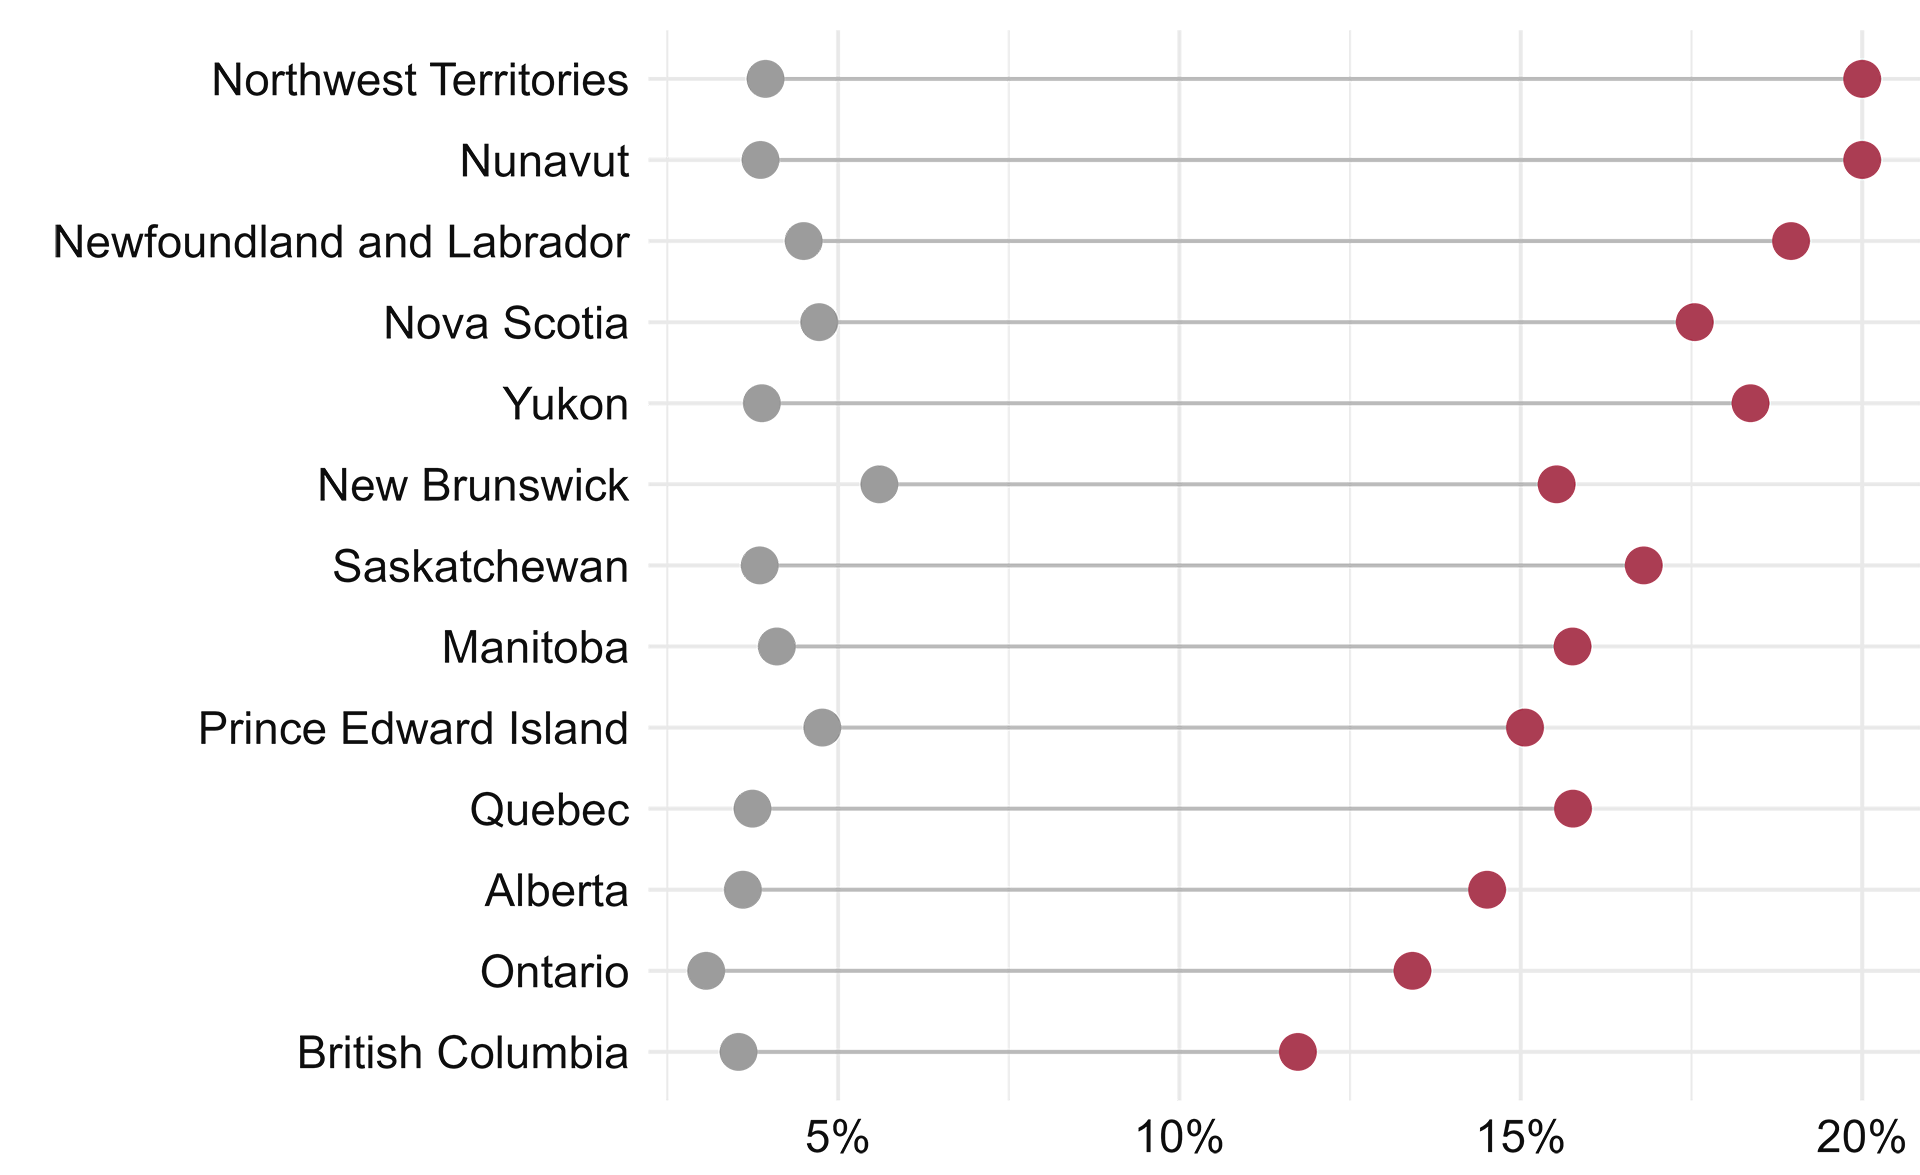
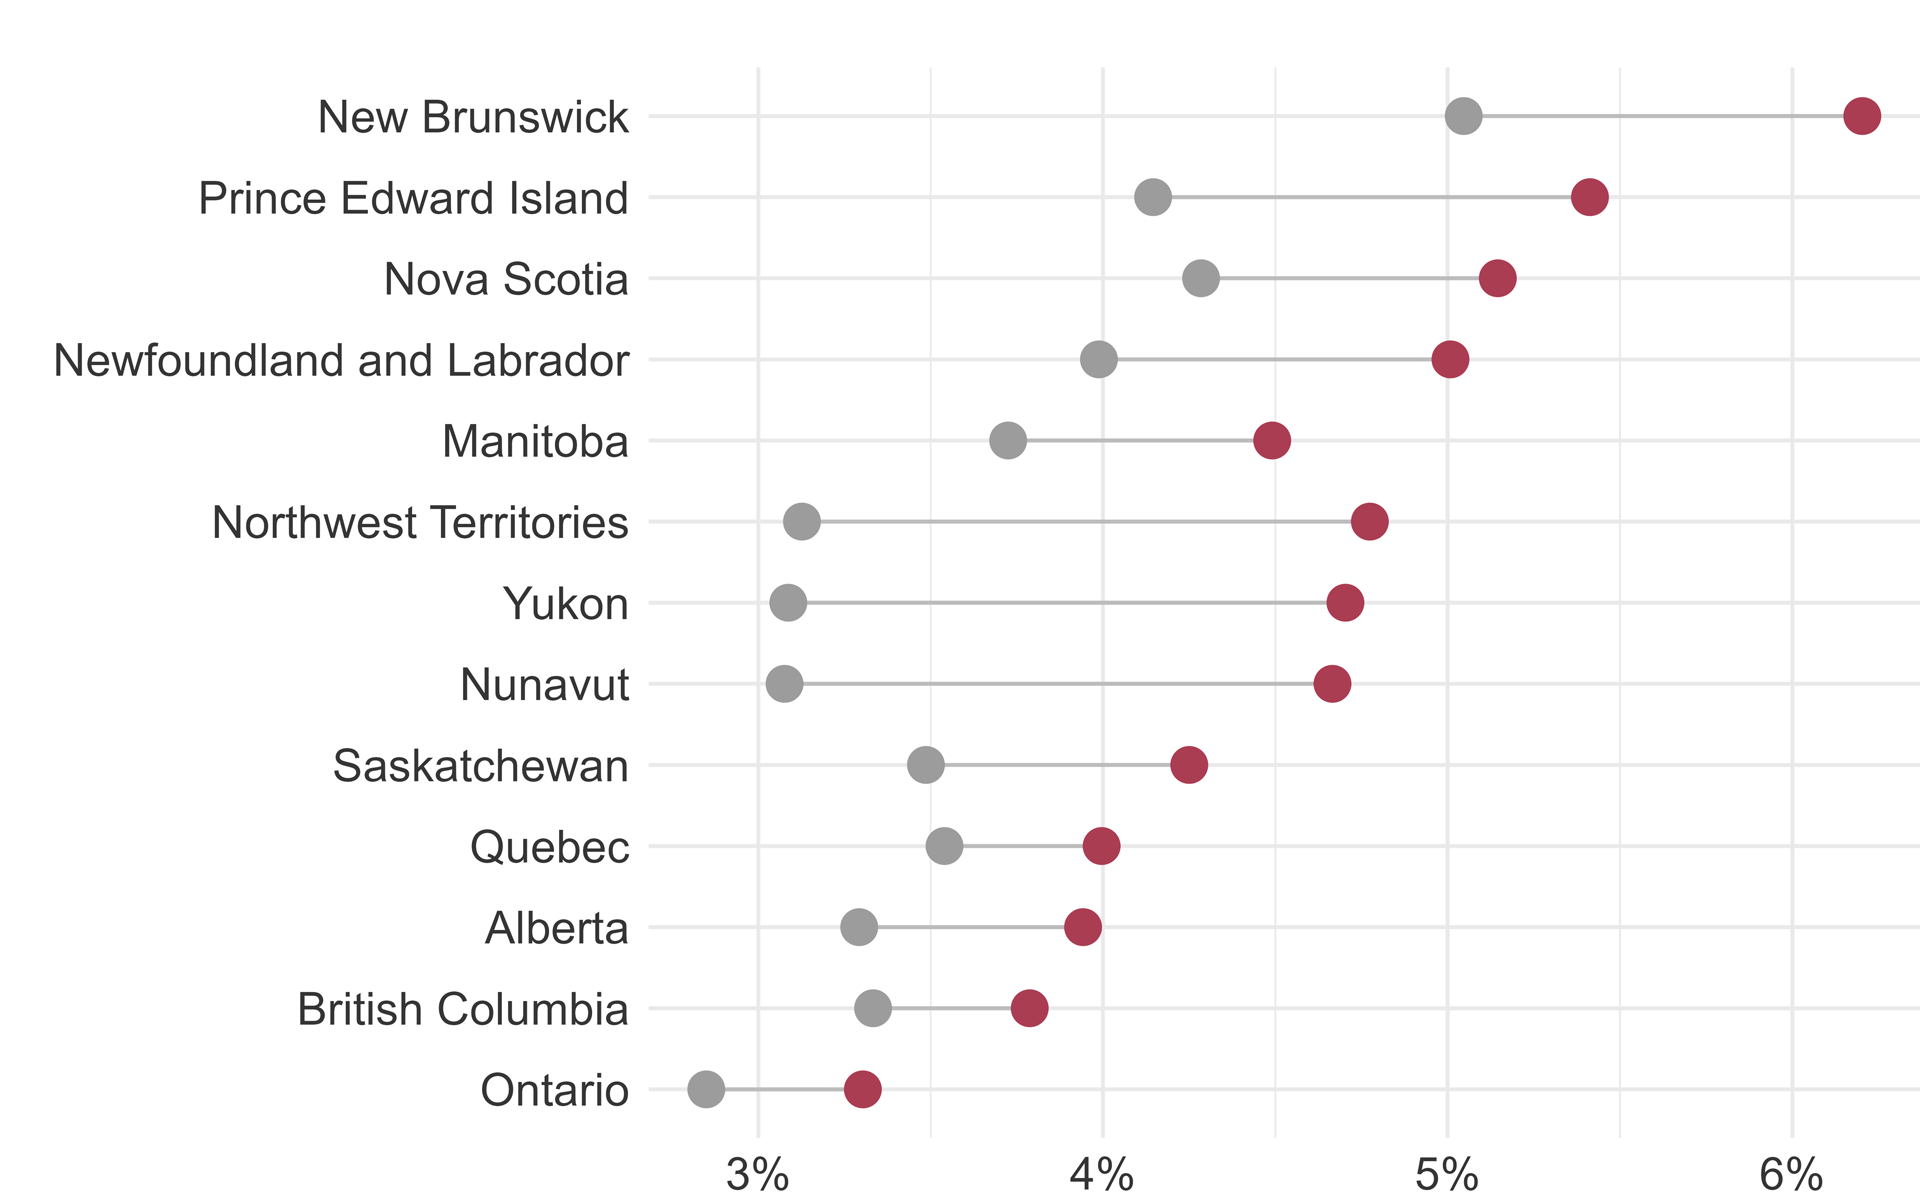
Figure 1 illustrates the overall prevalence of past-month ENDS use – a standard proxy for current use – across all ages, males and females for each province using the empirical estimates derived via the methods previously described. The map reveals that the highest use rates are concentrated in the Atlantic provinces, with New Brunswick (5.6%), Prince Edward Island (4.8%), Nova Scotia (4.7%), and Newfoundland and Labrador (4.5%) as the provinces with the highest rates of use followed by Manitoba (4.1%) in the Prairie region. The remaining provinces had overall ENDS use prevalence of less than 4%, with Ontario being the lowest at 3.1%.
As discussed, regulations for electronic cigarettes vary considerably across the provinces. Here, we summarize the provincial policies currently in place across the six major categories of ENDS use restrictions. Most provinces had less than the maximum number of policy controls implemented for the price, taxation, and advertising of e-cigarettes, with 8 provinces having no legislation related to price and taxation and 5 provinces having no legislation on advertising (Table 1). A further 5 provinces had no legislation related to controls on flavouring. Quebec announced plans to restrict flavours in vaping liquids in April 2023, however, the policy was yet to be fully implemented at the time of this report. Most provinces have some restrictions on ENDS use and sales location. As of 2023, Nova Scotia has implemented the most policies to restrict ENDS use and sale, followed by Nunavut and Prince Edward Island. The overall policy scores ranking in the province shows a moderate inverse correlation with the prevalence of e-cigarette use in the combined dataset. Pearson’s correlation (r) had a value of -0.36. We found a similar correlation (r = -0.36) when we examined the ENDS use prevalence for the most recent year of data (2021). This analysis was conducted to determine whether policies have a different relationship with recent ENDS use prevalence rates that are higher. We further detail ENDS use and sale policies at the federal and provincial levels, including legislation dates in the Appendix.
Criteria and Scores Comparing Provincial Policies on the Control of E-cigarettes and Vaping
| Province | Price and Taxation (3) | Retail Sale (4) | Controls on Flavouring (3) | Advertising (4) | Places that Prohibit Use (5) | Places that Prohibit Sale (5) | Overall Score (24) | Rank | Rank of E-cig |
|---|---|---|---|---|---|---|---|---|---|
| Ontario | 0 | 2 | 1 | 0 | 4.5 | 2.5 | 10 | 5 | 5 |
| British Columbia | 1 | 2 | 1 | 1 | 2 | 2 | 9 | 9 | 1 |
| Alberta | 0 | 2 | 0 | 1 | 4 | 1.5 | 8.5 | 11 | 6 |
| Quebec | 0 | 3 | 0 | 2 | 3 | 4 | 12 | 4 | 7 |
| Saskatchewan | 1 | 2 | 1 | 1 | 2 | 2 | 9 | 9 | 4 |
| Nunavut | 1 | 2 | 3 | 1 | 4 | 4 | 15 | 2 | |
| Yukon | 0 | 2 | 0 | 0 | 3 | 0.5 | 5.5 | 13 | |
| Northwest Territories | 0 | 2 | 3 | 0 | 3 | 1.5 | 9.5 | 8 | |
| Manitoba | 0 | 2 | 0 | 1 | 2.5 | 1 | 6.5 | 12 | 2 |
| Newfoundland and Labrador | 1 | 2 | 0 | 0 | 3 | 4 | 10 | 5 | 8 |
| Nova Scotia | 1 | 2 | 3 | 1 | 4.5 | 4 | 15.5 | 1 | 3 |
| Prince Edward Island | 0 | 4 | 3 | 1 | 2 | 3.5 | 13.5 | 3 | 9 |
| New Brunswick | 0 | 2 | 3 | 0 | 4.5 | 0.5 | 10 | 5 | 10 |
Note to table 1: Provinces are graded on six domains for policies related to e-cigarettes, ENDS devices and vaping. Within each domain, the maximum score is shown in brackets. The overall score is the summation of points across the domains, with a maximum score of 24. We then ranked each province and territory, with 1 corresponding to the most restrictive policies and 13 being the least restrictive. The rank for e-cigarette prevalence varies between 1 for the lowest prevalence and 10 for the highest. The e-cigarette ranks are applied to provinces only.
We examine crude correlations between e-cigarette use prevalence and the number of policies currently restricting ENDS use and sale at the provincial level. First, we use the e-cigarette prevalence from our combined dataset, estimates with our method over 2013-2021, with the ranking shown in the last column of Table 1. We also examine electronic cigarette use in 2021 to isolate policies’ effect on more recent e-cigarette use rates. Both analyses found a slight inverse association, suggesting that provinces with more stringent policies also had higher e-cigarette prevalence.
An examination of conventional cigarette use across the Provinces suggests a degree of discordance between e-cigarette use and conventional smoking. Quebec, which has higher smoking rates than the national average (15.7% for past 30-day use based on our estimates and 12.2% from the 2020-2021 Canadian Tobacco and Nicotine Survey), features lower vaping rates than nine other Provinces in our dataset. We estimated the vaping prevalence to be 3.7% across the study period. The province where past-month ENDS use is highest – New Brunswick (5.6%) – has a similar rate of conventional smoking as Quebec, but was among the lowest for prevalence of current ENDS use in this evaluation (Figure 3). This comparison does not account for the intensity of one’s use of either product. Different patterns may be revealed along dimensions of use intensity, including cigarettes consumed per day among smokers or analogous measures of ENDS use intensity.
The (dis)concordance between conventional and electronic cigarette use across the provinces is shown in Figure 3 below.

E-cigarette

Cigarette
Figure 3. —
Past-month e-cigarette use by active smoking status and Province
The associations between provincial vaping and smoking rates are variable. Select Provinces (e.g., Ontario) demonstrate more efficacy in controlling the use of ENDS and combustible cigarettes. In contrast, others either feature relatively high rates of both (e.g., Nova Scotia) or asymmetries in the prevalence of either (e.g., Quebec, New Brunswick), adding to the evidence of a variable landscape in nicotine use across the provinces.
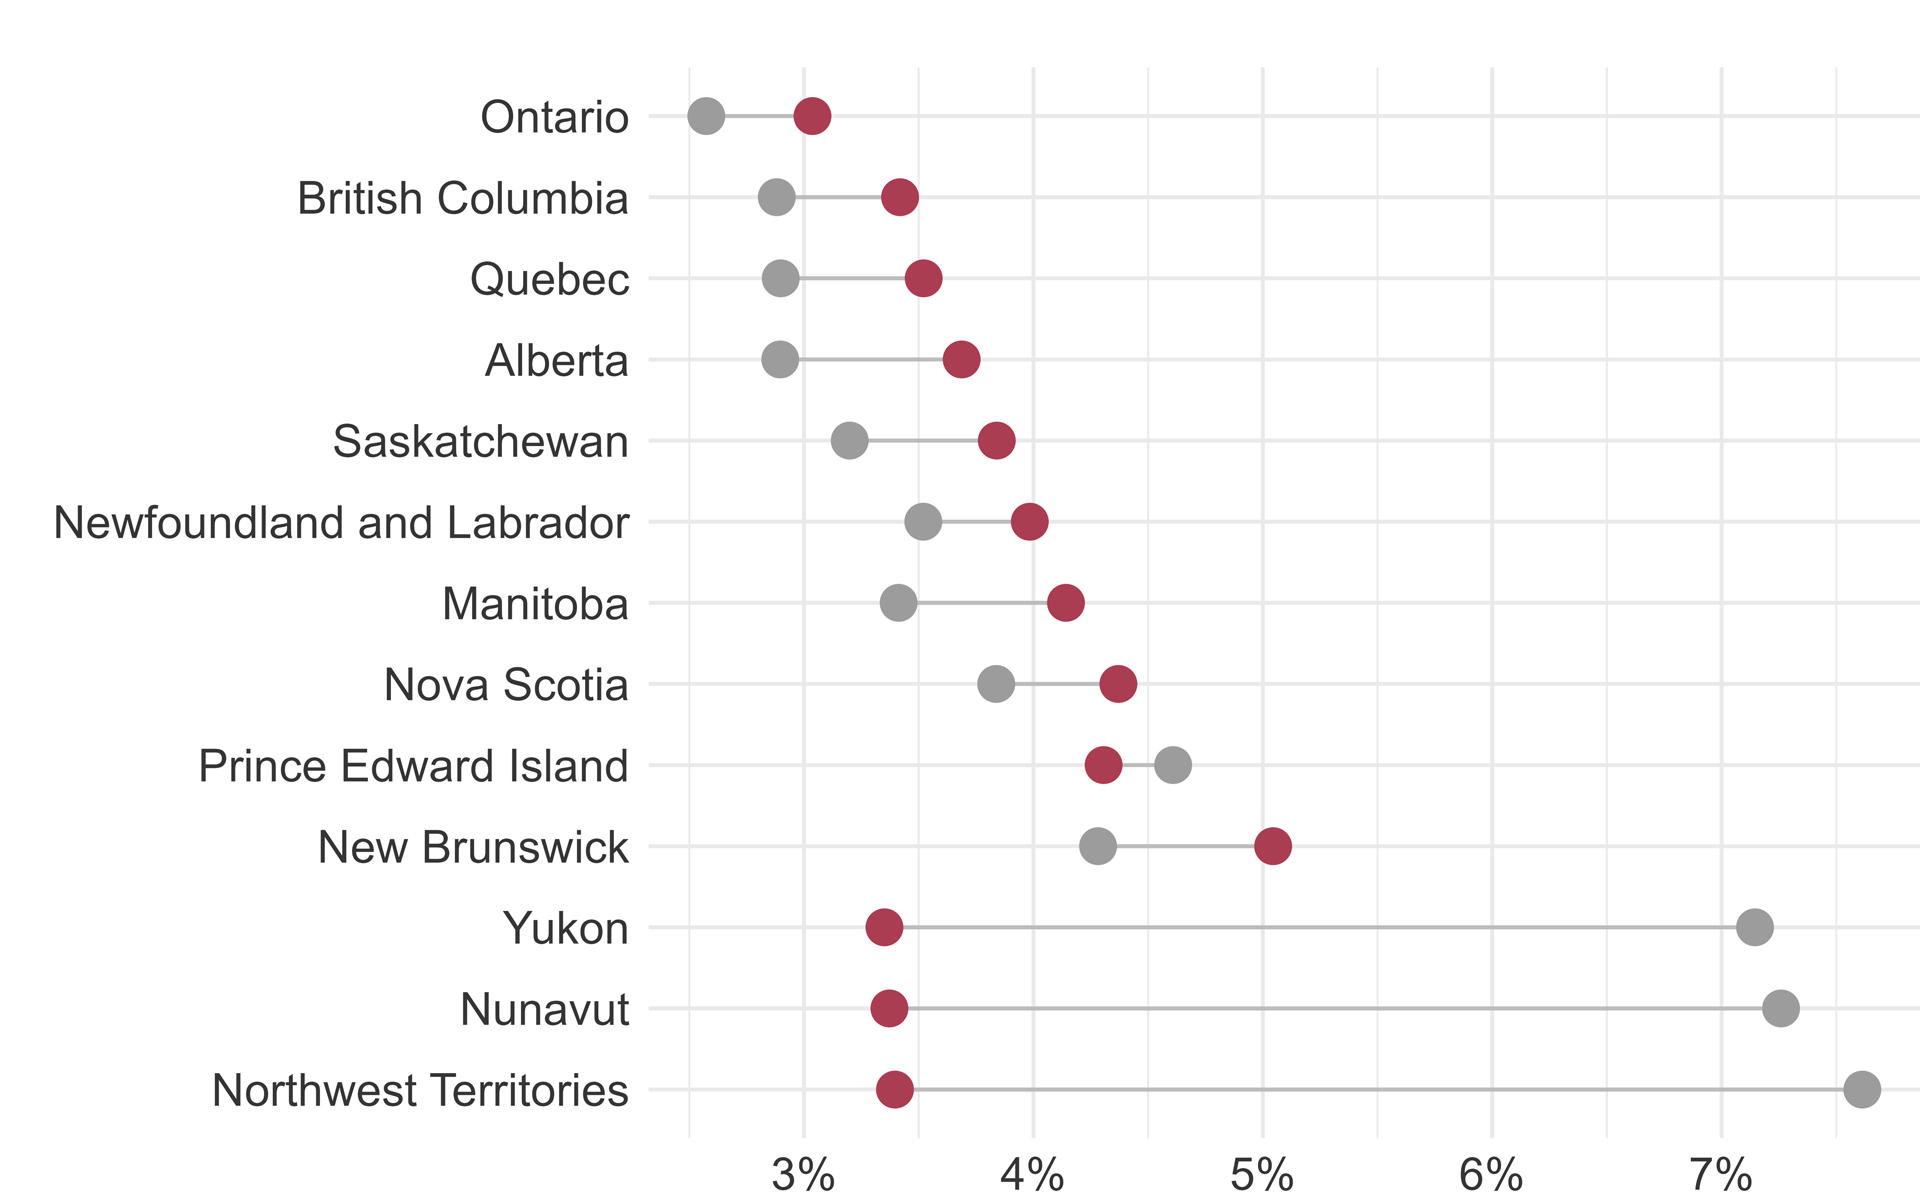
In addition to smoking status, male sex/gender has repeatedly been identified in past studies as a risk indicator of e-cigarette use.24,26 Our data also illustrate this finding and clearly show that across all provinces, men and boys are more likely to have used e-cigarettes in the past month than women and girls (Figure 4).
Male
Female
Figure 4. —
Past-month e-cigarette use by sex and province
≥ 20 years old
Under 20 years old
Figure 5. —
Past-month e-cigarette use by age and province
Across most Provinces, ENDS use rates are higher among adults aged 20 and older than adolescents under 20. Exceptions include the Territories and Prince Edward Island, where precision-weighted estimates of past-month e-cigarette use are higher among adolescents (4.6%) than adults (4.3%) – concerning findings given the association between e-cigarette use and future smoking initiation among younger ENDS users.6 Other noteworthy findings from Figure 5 include the low active vaping rates among both youth and adults in Ontario. The empirically-estimated prevalence of past-month vaping among teenagers in Ontario is 2.6%, compared to 3% for adults. With lower rates of youth and adult ENDS use than all other provinces and lower rates of smoking than all others but British Columbia (adult smoking only), our data suggest that Ontario is performing well in nicotine abstinence across several measures.
We now focus on the geographic unit of the Census Division (CD). While CDs may not be imbued with the legislative power of provinces, they are closer approximations of the communities that everyday citizens engage with on a daily basis. Indeed, demographers have documented the importance of “spatial scale” in approximating the borders that community dwellers identify as their communities.44 As such, any study of communities and health is well-advised to consider multiple spatial scales in defining a community and its relation to the conditions that create healthy and unhealthy places. This includes exposures to nicotine and e-cigarette advertisements, limits to local product availability and use opportunities, and the cultural conditions shaping high or low rates of nicotine consumption. As such, we view CDs akin to the community settings in which health behaviours – like vaping – unfold or fail to.
Inset maps are provided to discern more clearly nicotine use patterns in the smaller geographies along the population corridors of Ontario and Quebec – home to the Toronto, Ottawa, and Montreal metropolitan areas. Figure 6 illustrates the spatial dispersion of ENDS use across CDs, highlighting sub-provincial variation in ENDS use rates concealed by the lower spatial resolution at the provincial level. Results in this figure show that even in the provinces with the lowest rates of ENDS use, the prevalence of vaping is not uniform across CDs. Ontario – the province with the lowest overall rates of vaping – is home to several CDs with vaping rates eclipsing 20%. The Sudbury District northwest of Toronto is one such district, with past-month vaping rates exceeding 10%. Similarly, the districts of Lennox-Addington and Leeds-Grenville in southeastern Ontario bear ENDS use rates that deviate from the provincial norm.
Moving further east reveals select CDs with high e-cigarette use relative to the rest of the province. Acton, Coaticook, Les Sources, and Sherbrooke districts east of the Montreal metroplex have higher rates than their peers in Quebec. With some exceptions (e.g., Charlevoix Est) the prevalence of ENDS use in the remaining districts in Quebec largely adhere to the patterns shown at the provincial level.
While the overall rate of ENDS use in Quebec is comparatively low to its peers, rates of use are high in the neighbouring provinces of New Brunswick, Nova Scotia, and Prince Edward Island. Figure 6 suggests that a few select districts within these Provinces drive this. Although New Brunswick features the highest overall rates of ENDS use, this is primarily driven by vaping behaviours in only two districts: Northumberland and Saint John. Similarly, Nova Scotia’s high use rates result from vaping behaviours prevailing in Guysborough and Cape Breton. In Prince Edward Island, vaping rates are highest in Prince County – lending to the higher overall rates of ENDS use in the province.
Similar patterns of high rates of ENDS use in select suburban, exurban, and rural CDs are evident across the country. In the Greater Vancouver CD, rates are below 4% – the second lowest category of ENDS use prevalence – while in the Sunshine Coast district just north of the Vancouver metropolitan area, rates eclipse 6%. In the central Prairie Regions of Alberta, Saskatchewan, and Manitoba, high rates of e-cigarette use are noted in select, largely exurban and rural districts flanking the US border, including Manitoba’s Division 8 – home to the lands of the Sandy Bay and Long Plain First Nations peoples.
Similar to the Provincial level, the concordance between conventional and electronic cigarette use at the CD level is inconsistent. Figure 7 shows that along the population corridors and principal cities of Ontario and Quebec, numerous districts with high – and in some cases the highest – rates of conventional smoking are the same with low vaping rates. ENDS use is relatively common in the suburban districts connecting Ottawa to Montreal and in the exurban and rural areas of Quebec shown in the inset map above – compared to the urban core areas where vaping rates are modest at best.
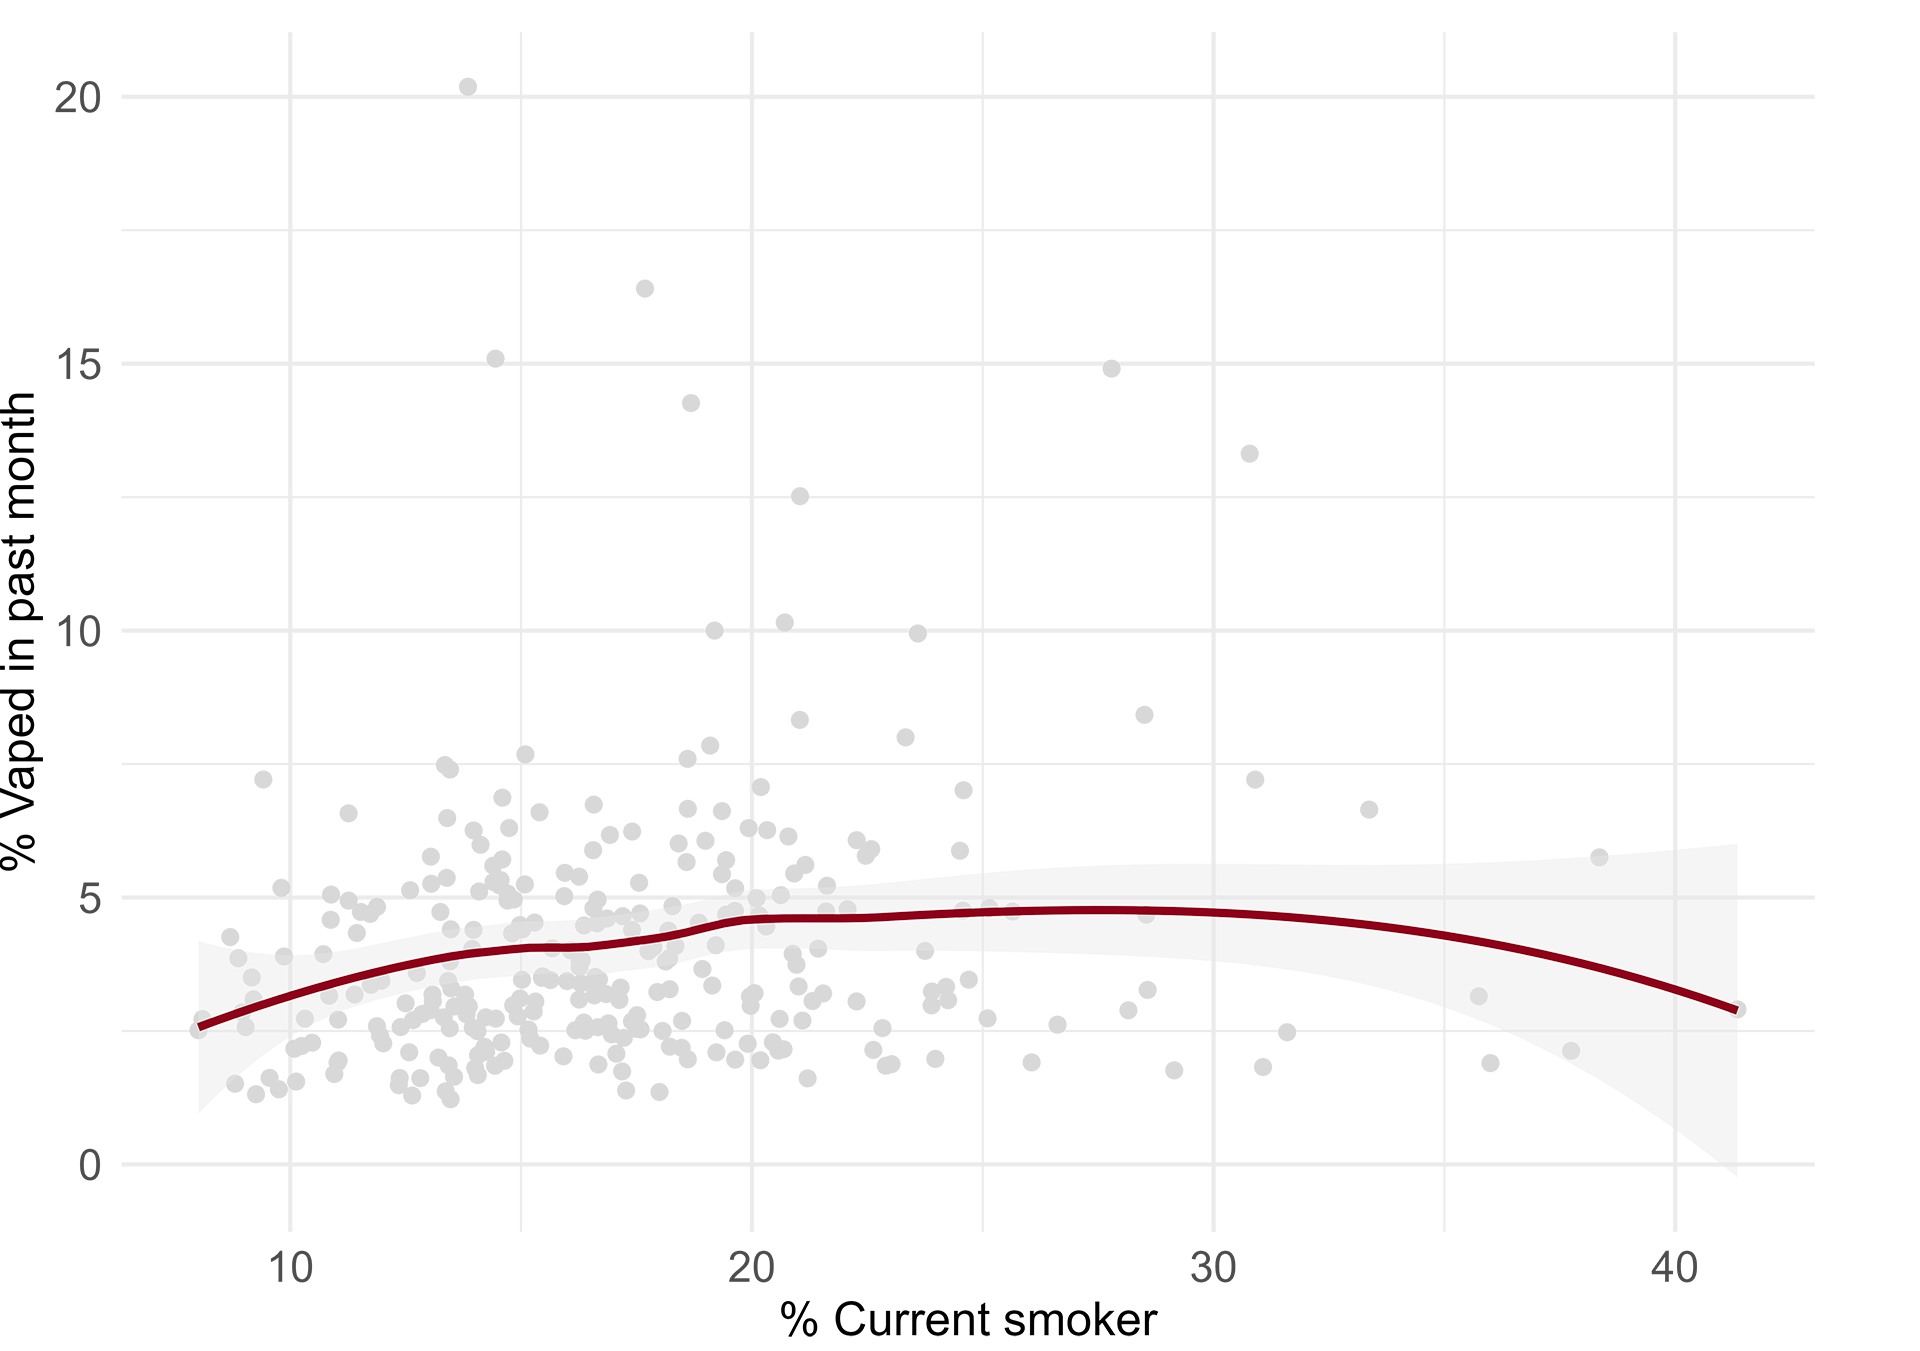
To illustrate these patterns differently, we look at the relationship between conventional smoking and e-cigarette use across 282 CDs in our dataset. The major finding is that there was only modest concordance between smoking and vaping (Figure 8).
The figure below portrays the generally positive relationship between conventional smoking at the CD level and the prevalence of vaping, particularly in CDs with conventional smoking rates of less than 25%. While the bivariate association between combustible and electronic cigarette use is statistically meaningful (p < .05) and positive, it is not strong by conventional standards, yielding a Pearson’s correlation coefficient of only 0.15. Regional variation in this relationship and some outlier districts with higher conventional smoking and moderate vaping, and vice-versa likely contribute to the modest relationship between both forms of nicotine use at the national level.
Estimates based on 282 Census Divisions, excluding those in the Northwest Territories, Nunavut, and Yukon
Figure 8. —
Correlation between conventional and electronic cigarette use among Census Divisions

Atlantic

Ontario

Quebec

Prairie

British
Columbia
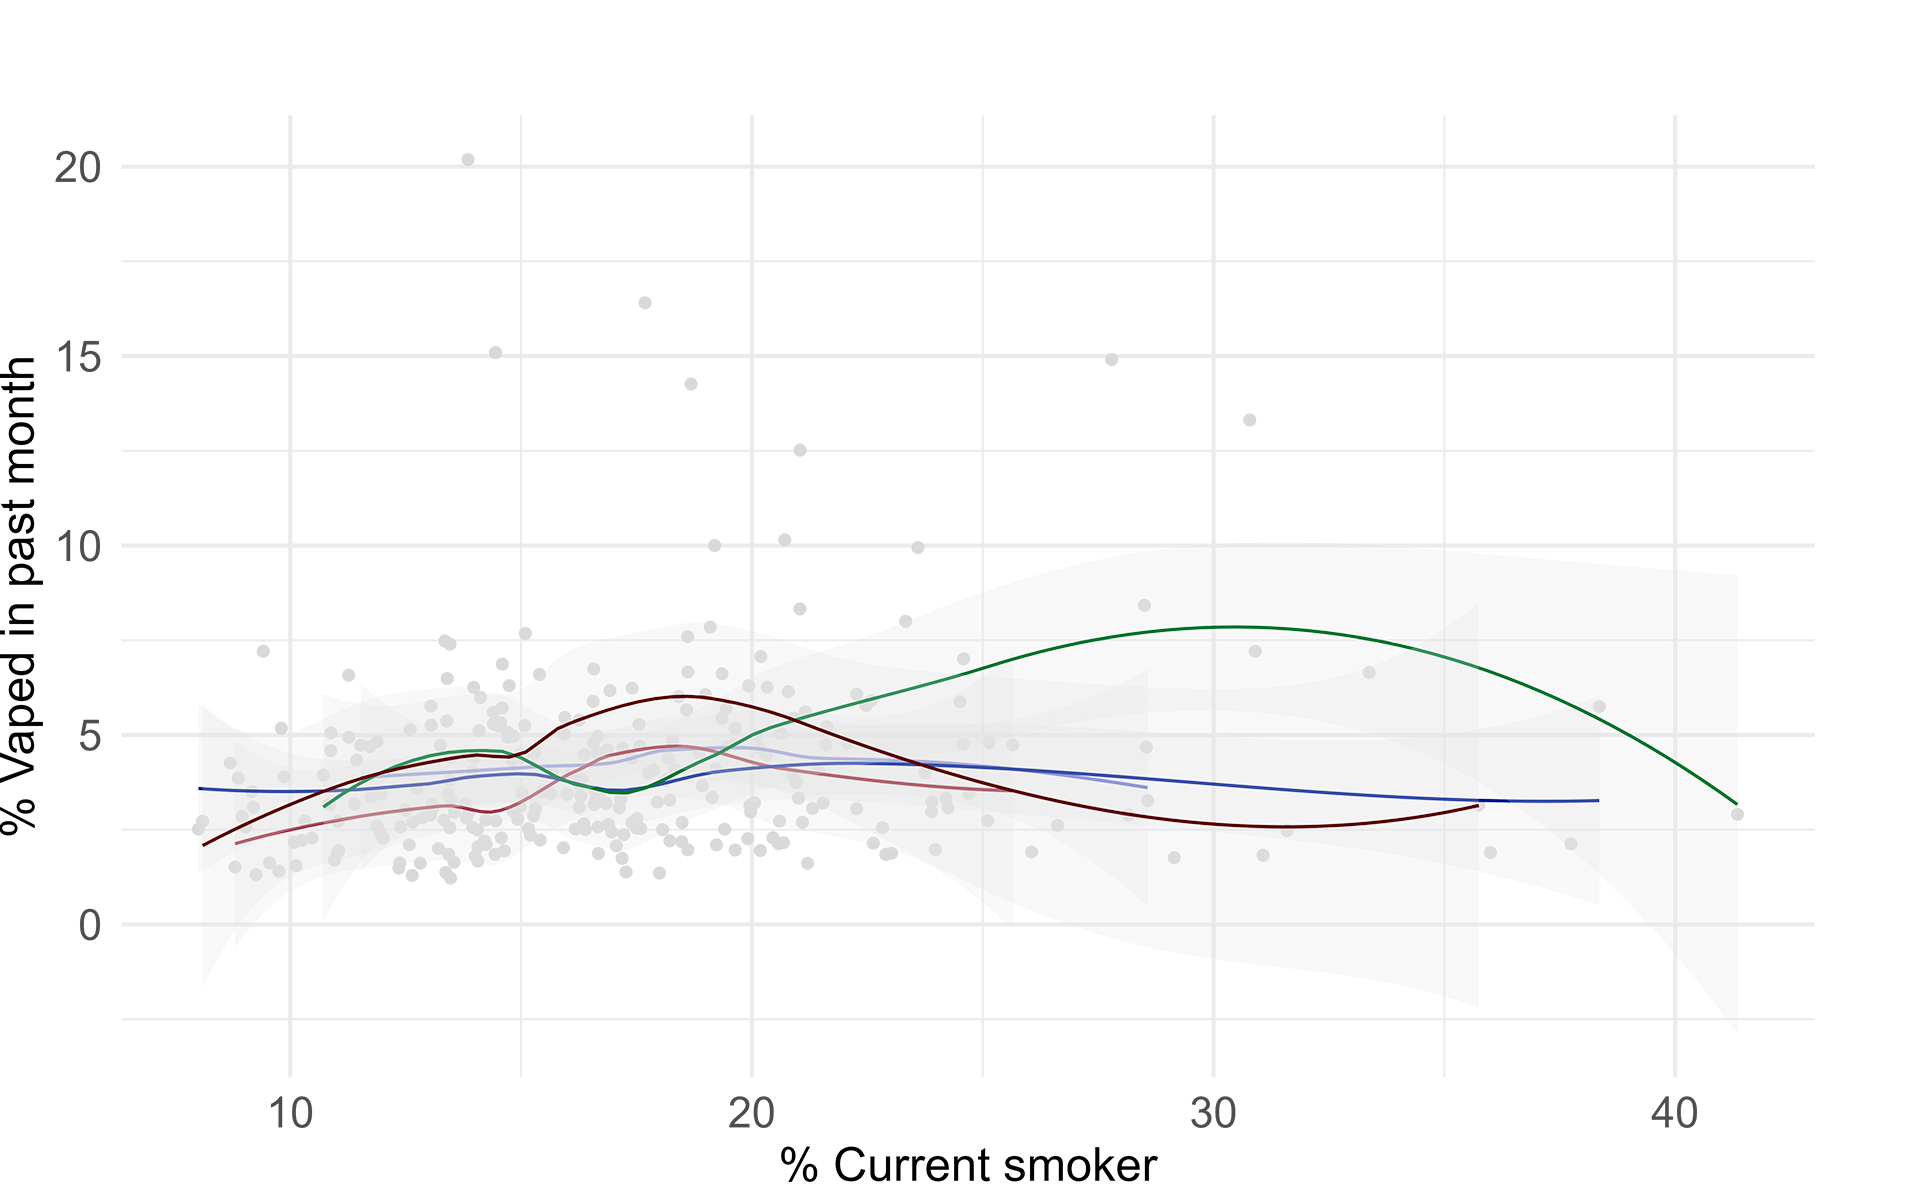
Estimates based on 282 Census Divisions, excluding those in the Northwest Territories, Nunavut, and Yukon. Atlantic region includes New Brunswick, Nova Scotia, and Prince Edward Island. Prairie region includes Manitoba, Saskatchewan, and Alberta
Figure 9. —
Correlation between conventional and electronic cigarette use among Census Divisions by Region
A similar relationship was observed within selected regions and provinces (Figure 9). The association between conventional smoking and e-cigarette use was generally positive across most CDs. However, there appear to be several outlier CDs where current smoking rates are relatively high, but e-cigarette use is moderate. In contrast, a few other CDs have high rates of vaping without a corresponding increase in conventional smoking.
Estimates presented as Pearson correlation coefficients accompanied by 95% confidence intervals

Vaping

Smoking
Figure 10. —
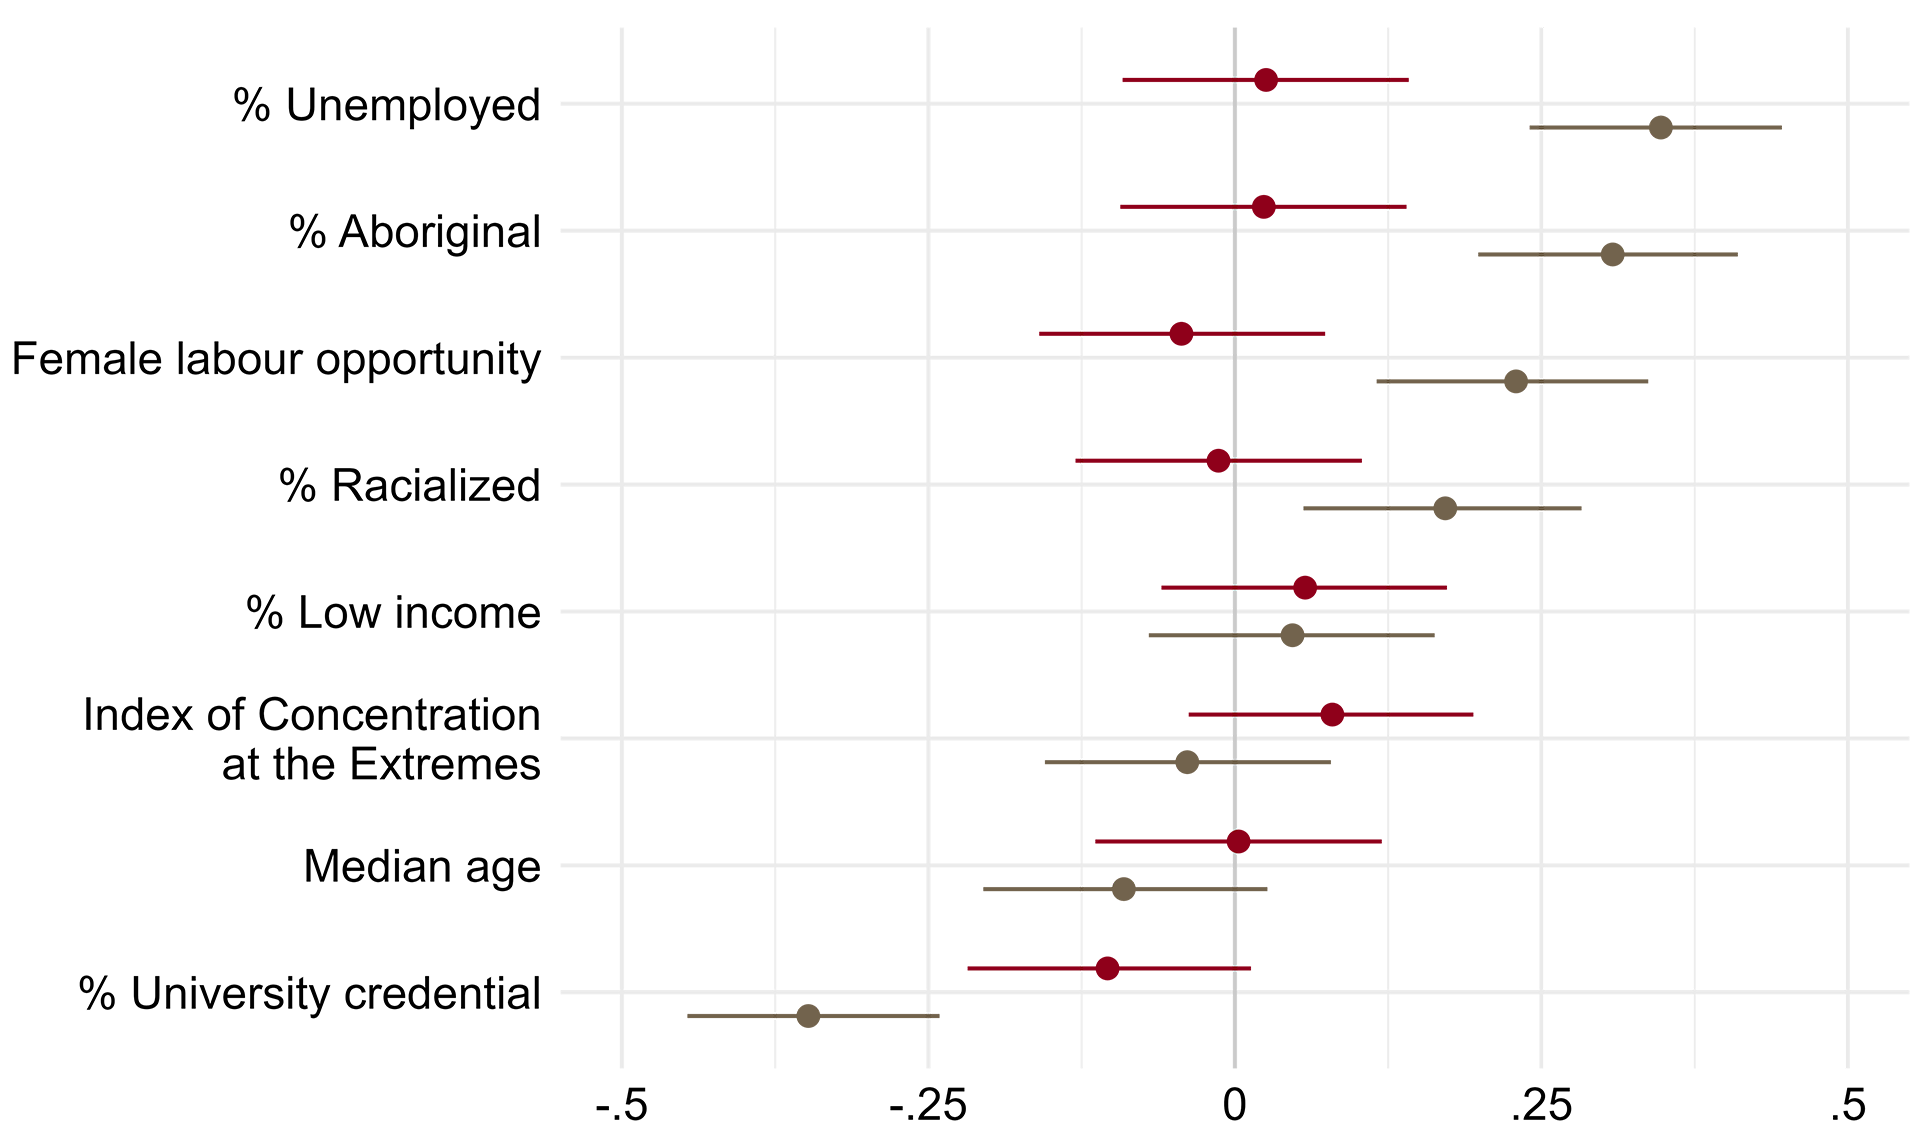
Correlations of vaping and smoking with area-level demographic and socioeconomic indicators
Associations between Current Smoking and Electronic-cigarette Use Prevalence by Demographic and Socioeconomic Indicators in Census Divisions.
We use bivariate correlations (Figure 10) to assess associations between electronic and conventional cigarette usage and CD-level demographic and socioeconomic correlates. Across CDs, certain demographic characteristics were associated with higher rates of conventional smoking but not vaping, including higher unemployment, a greater proportion of indigenous and racialized persons, and increased female labour opportunities. In contrast, smoking rates were significantly lower in CDs with a greater share of the population with university degrees. Electronic cigarette use prevalence was also moderately inversely correlated with the proportion of individuals with university degrees, although the other characteristics were not associated with e-cigarette use.
Basic correlations provide an instructive if preliminary, glimpse of the community traits associated with high and low rates of nicotine use, but ignoring the spatial structure of such associations risks introducing bias into empirical estimates. This is because health phenomena and their correlates tend to cluster in space, and ignoring this clustering can attenuate associations between seemingly-unrelated factors. We address this possibility by defining “spatial neighborhoods” for CDs in the study, omitting the vast geographic borders of the Territories where CD-level spatial analysis is impractical. This definition is based on a three-nearest neighbor approach – an approach which begins by identifying the geographic centroid of each Census Division and calculating its three nearest neighboring CDs on the basis of Euclidean distances from CD centroid (an “as the crow flies” method). This approach overcomes the challenges of relating CDs sharing a spatial neighborhood that may include water boundaries separating the closest CDs from one another.
In our analysis the 3-neighbor solution yielded the highest Moran’s i value – an indicator of spatial clustering, and the preferred metric for evaluating alternative methods of defining a spatial neighborhood like adjacency-based methods like the queen’s or rook’s approach.45 For past-month e-cigarette use at the CD level, the Moran’s i value was equal to .23 – a value that is indicative of moderate though significant spatial clustering evidenced by a p-value < .001 derived via Monte Carlo simulation with 1,000 iterations.
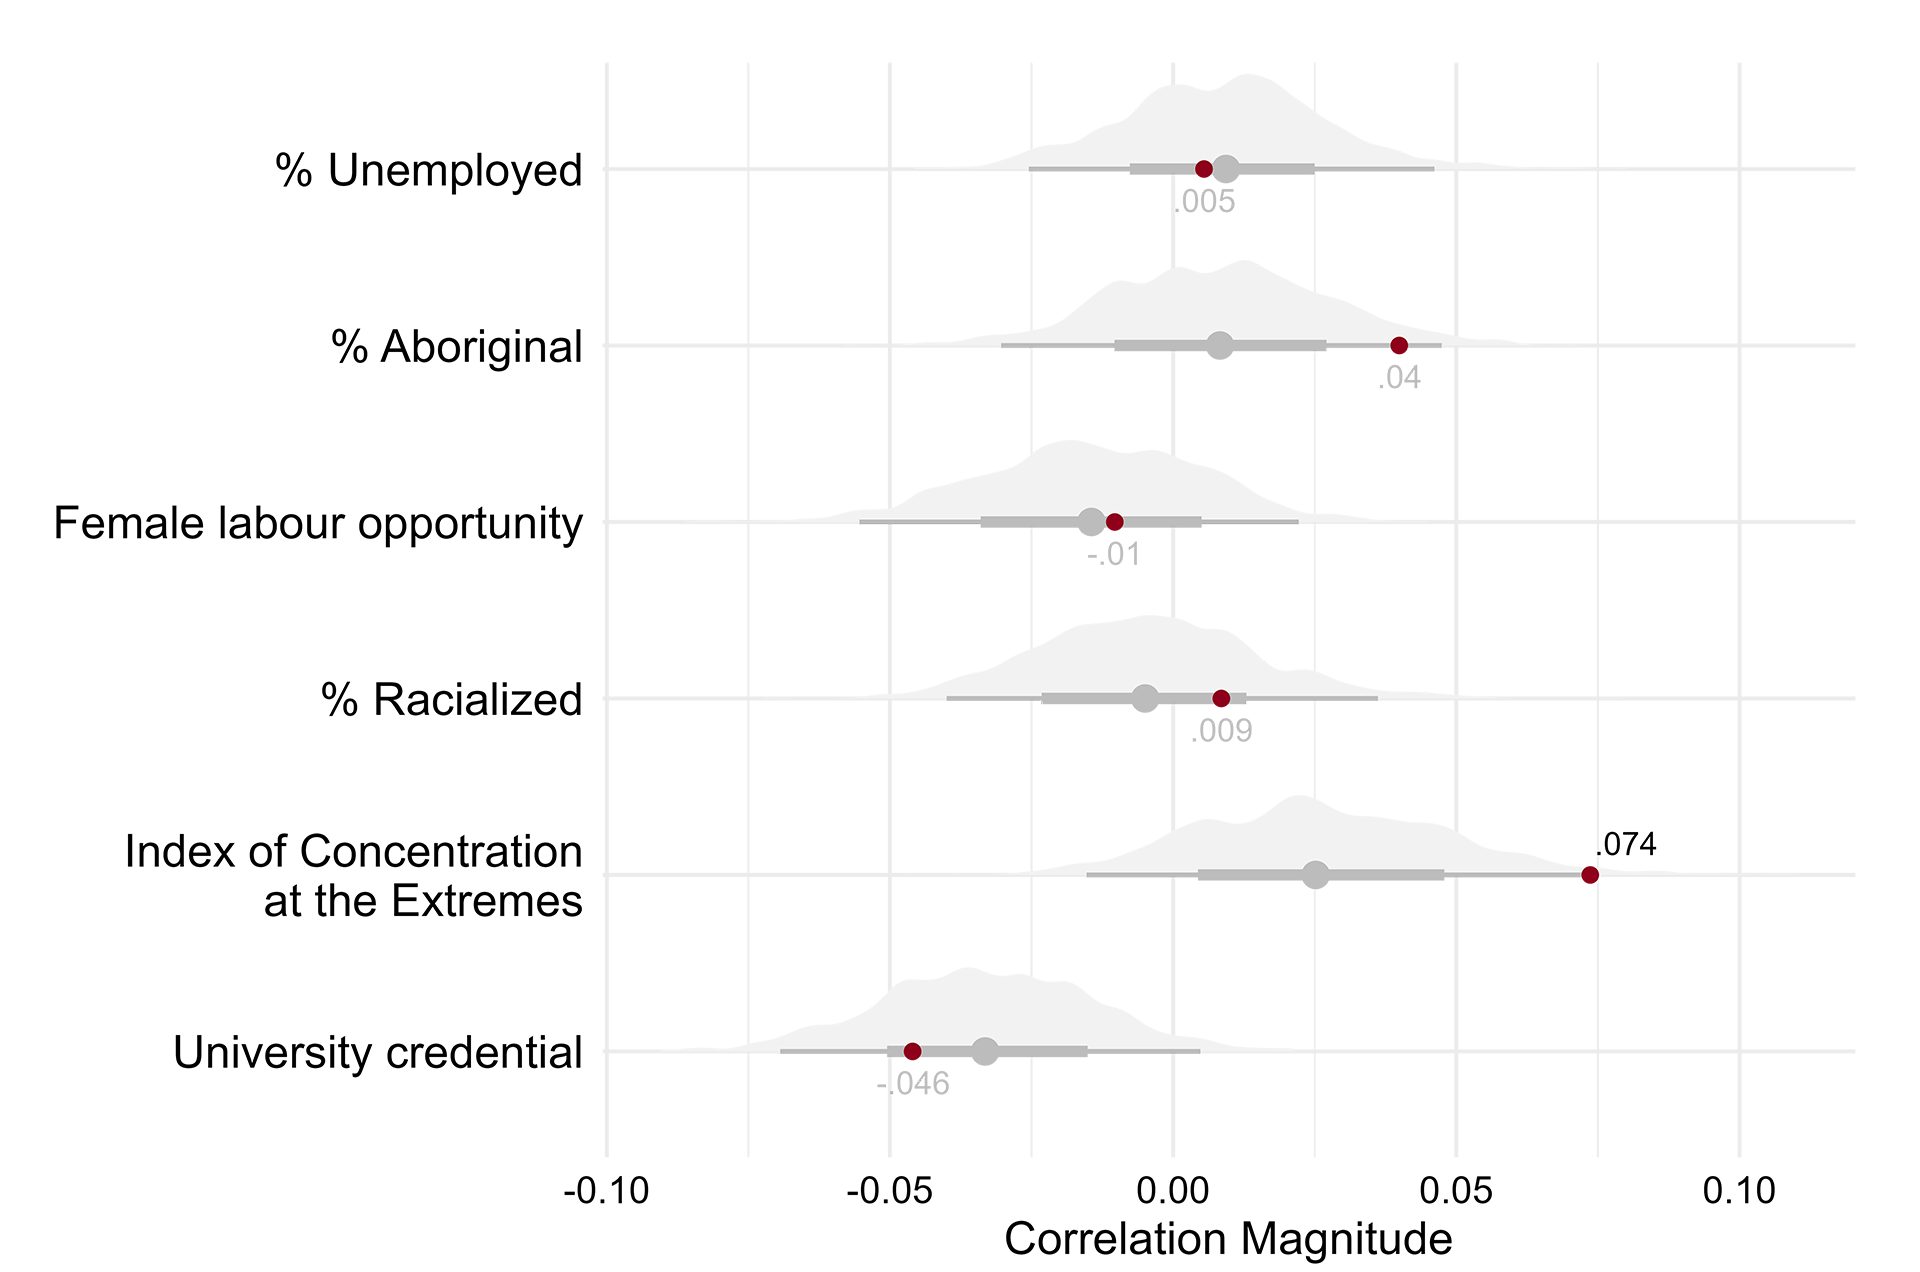
Correlation coefficients (shown in red) are based on Lee's L method which accounts for spatial autocorrelation of both the outcome and its correlates. Distributions and box plots are based on 1,000 simulated correlations of randomized values for the outcome and correlates. Correlation coefficients lying outside of these regions are unlikely due to chance alone.
Figure 11. —
Spatial correlations of vaping with area-level traits
Following identification of the spatial neighborhood, spatial weights (see Eq 3) are derived to ‘weight’ correlations between vaping rates and CD-level correlates, correcting for the spatial autocorrelation of both correlates and ENDS use across CDs sharing a spatial neighborhood. Figure 11 displays results from this exercise and provides some evidence that biases associated with spatial autocorrelation are consequential to identifying the associations sought in Figure 10. Two pieces of information are shown in the figure: (1) a distribution of correlation terms derived from 1,000 permutations of randomized data for both vaping and correlates, and (2) actual correlation coefficients obtained using the Lee’s l method. Correlation coefficients with values lying outside the range of correlations derived from randomized data are unlikely by chance alone. Using this method, we find that our measure of economic segregation and income composition (the index of concentration at the extremes, or “ICE”) is significantly and positively associated with e-cigarette use after adjusting for the spatial autocorrelation of vaping and the ICE metric (ᴩ = .074, simulated p-value < .05). We note that the magnitude of this association on a scale ranging from -1 to +1 – is small, even if it is significant in statistical terms. No other correlation coefficient had a significant [simulated] p-value, as illustrated by their positioning within the range of simulated correlations from randomized data.
In recent years, the use of electronic cigarettes and electronic nicotine delivery systems (ENDS) have rapidly expanded in Canada. Following their introduction to Canadian markets in 2004, the rising popularity of vaping – particularly among teenagers and young adults – has fueled a resurgence in nicotine use following decades of decline from the mid-1990s. These trends are concerning for several reasons:
The increased use of electronic cigarettes threatens the progress made in nicotine abstinence since the mid-1990s.
Vaping and its role in tobacco initiation.
Increases in ENDS use may portend an increasing prevalence of ENDS-related sequelae observed among youth, including respiratory illness and carcinogenic exposure.
Recent evidence indicates very few positive use cases among younger populations, who show little sign of ENDS use for tobacco cessation.
The emphasis of this work was to provide a better understanding of the scope and magnitude of ENDS use across geographic, demographic and socioeconomic communities and to help identify areas where a further policy response to ENDS use may be warranted. Our primary findings include that the provinces with the highest ENDS use prevalence were in the Atlantic Provinces (New Brunswick, Prince Edward Island, Nova Scotia, Newfoundland and Labrador), followed by Manitoba. Second, our sub-provincial estimation revealed considerable variability in e-cigarette use across Census Divisions. Select suburban and exurban communities in the population corridors of Ontario and Quebec have relatively high vaping rates – suggesting an urban advantage, with low rates of vaping in cities suggesting that centralized urban communities may be better able to control ENDS use than outlying communities. We further identified that males are far more likely to use ENDS products across all provinces than females. Last, there was a moderate and inverse relationship between provincial policies implemented to control ENDS use and ENDS use prevalence, suggesting that policies may be implemented after ENDS prevalence increases, although further investigation is required.
This project is the first detailed data atlas on the current geographic distribution of vaping prevalence in Canada across all age groups, along with its community-level, demographic, and socioeconomic correlates. Current data limitations prevent understanding adolescent and adult vaping and the community-level correlates associated with ENDS use. Our application of precision-weighted estimation via multilevel modelling provides one approach to addressing this data gap and a public research tool to assess community ENDS use and ecological factors associated with vaping. This information will enable healthcare professionals, policy planners, researchers, and the public to understand the scope of the epidemic in Canada and facilitate strategies to reduce ENDS use among youth and young adults.
Despite the advantages of our methodology, there are some limitations. One limitation is that obtaining a sufficient sample size across geographic areas necessitated pooling multiple surveys over 8 years. The resulting data may reduce temporal variability, which may be a limitation given the rapidly changing rates of ENDS use prevalence in Canada. In addition, we pooled surveys with somewhat different designs and sample methodologies that may introduce some variability in the data. We favoured these decisions to pool the data in this way to obtain robust estimates of vaping by geography and to focus on understanding regional and provincial variability in vaping patterns. Therefore, the vaping rates presented here should be considered the ‘average’ rates across the study period. In some instances, we provide the most recent data from a single survey in 2021 as a comparison. An additional limitation is that the precision-weighted estimation to provide area-specific predictions has some uncertainty, and all regions are treated as part of a larger ‘distribution’. To address this, we did not specifically compare any 2 regions to see which had a higher or lower rate of e-cigarette use prevalence. The fact remains that better and high-resolution data on vaping is needed in Canada to track these critical changes over time and across regions.
Based on our findings, we offer the following recommendations to address the control of ENDS use in Canada and to guide future research priorities in this area.
First, ENDS, including e-cigarettes and novel vaping products, appear to have limited use for tobacco cessation and may increase the likelihood of conventional cigarette use.
These products often directly appeal to youth through flavourings and online and social media advertisements. Most provinces already restrict locations where ENDS can be used and sold; however, additional restrictions around flavoured products are only established in a handful of jurisdictions. In addition, stricter controls on advertising and implementing additional taxes on consumers or costs and fees to manufacturers may result in reductions in vaping rates.
Second, our inverse correlation between policy implementation and vaping rates suggests that these policies are applied in response to vaping increases. Therefore, we urge providers such as Ontario, where rates are still somewhat lower, to pre-emptively introduce legislation that could control further increases in vaping prevalence.
Third, some of the highest-use areas appear to be suburban and exurban communities outside of major urban centres. The discordance in vaping use rates between cities and the surrounding communities may be occurring for several reasons, including that cities and municipalities may introduce local bylaws or legislation to further control ENDS within their geographic boundaries, either through advertising, sale, or other restrictions that may not exist in the outlying communities. Further, obtaining ENDS products in smaller communities outside of large urban centres may be easier or cheaper. Therefore, we would strongly suggest additional policy controls and enforcement be targeted in these regions where other legislation may be lacking. Due to the nature of the legislative structure in Canada, this would likely have to come directly from the provincial governments.
§ Heart and Stroke Foundation. Policy Statement: E-cigarettes in Canada. 2018. (accessed May 25 2020).
Sapru S, Vardhan M, Li Q, Guo Y, Li X, Saxena D. E-cigarettes use in the United States: reasons for use, perceptions, and effects on health. BMC public health 2020; 20(1): 1-10.
Dutra LM, Grana R, Glantz SA. Philip Morris research on precursors to the modern e-cigarette since 1990. Tob Control 2017; 26(e2): e97-e105.
Health Canada. Canadian Tobacco and Nicotine Survey (CTNS): summary of results for 2020. Health Canada, 2022.
Reid JL, Rynard VL, Czoli CD, Hammond D. Who is using e-cigarettes in Canada? Nationally representative data on the prevalence of e-cigarette use among Canadians. Prev Med 2015; 81: 180-3.
Yoong SL, Hall A, Turon H, et al. Association between electronic nicotine delivery systems and electronic non-nicotine delivery systems with initiation of tobacco use in individuals aged < 20 years. A systematic review and meta-analysis. PLoS One 2021; 16(9): e0256044.
Traboulsi H, Cherian M, Abou Rjeili M, et al. Inhalation Toxicology of Vaping Products and Implications for Pulmonary Health. Int J Mol Sci 2020; 21(10).
Lerner CA, Rutagarama P, Ahmad T, Sundar IK, Elder A, Rahman I. Electronic cigarette aerosols and copper nanoparticles induce mitochondrial stress and promote DNA fragmentation in lung fibroblasts. Biochem Biophys Res Commun 2016; 477(4): 620-5.
Yogeswaran S, Muthumalage T, Rahman I. Comparative Reactive Oxygen Species (ROS) Content among Various Flavored Disposable Vape Bars, including Cool (Iced) Flavored Bars. Toxics 2021; 9(10).
Huilgol P, Bhatt SP, Biligowda N, Wright NC, Wells JM. Association of e-cigarette use with oral health: a population-based cross-sectional questionnaire study. J Public Health (Oxf) 2019; 41(2): 354-61.
Ruszkiewicz JA, Zhang Z, Goncalves FM, Tizabi Y, Zelikoff JT, Aschner M. Neurotoxicity of e-cigarettes. Food Chem Toxicol 2020; 138: 111245.
Pushalkar S, Paul B, Li Q, et al. Electronic Cigarette Aerosol Modulates the Oral Microbiome and Increases Risk of Infection. iScience 2020; 23(3): 100884.
Ling PM, Glantz SA. Tobacco industry consumer research on socially acceptable cigarettes. Tob Control 2005; 14(5): e3.
U.S. Food and Drug Administration. Results from the Annual National Youth Tobacco Survey. 2022. (accessed June 30 2023).
Centers for Disease Control and Prevention (U.S.). E-cigarette, or vaping, products visual dictionary. 2019. p. 1-25.
Kosmider L, Sobczak A, Fik M, et al. Carbonyl compounds in electronic cigarette vapors: effects of nicotine solvent and battery output voltage. Nicotine Tob Res 2014; 16(10): 1319-26.
Fadus MC, Smith TT, Squeglia LM. The rise of e-cigarettes, pod mod devices, and JUUL among youth: Factors influencing use, health implications, and downstream effects. Drug Alcohol Depend 2019; 201: 85-93.
Kaplan S. Juul Is Fighting to Keep Its E-Cigarettes on the U.S. Market. New York Times. 2021.
Londeree AM, Roberts ME, Wewers ME, Peters E, Ferketich AK, Wagner DD. Adolescent Attentional Bias toward Real-world Flavored E-cigarette Marketing. Tob Regul Sci 2018; 4(6): 57-65.
Struik LL, Dow-Fleisner S, Belliveau M, Thompson D, Janke R. Tactics for Drawing Youth to Vaping: Content Analysis of Electronic Cigarette Advertisements. J Med Internet Res 2020; 22(8): e18943.
Government of Canada. Order Amending the Schedule to the Tobacco Act (Menthol). 2017.
U.S Food and Drug Administration. Family Smoking Prevention and Tobacco Control Act – An Overview. 2020. (accessed June 30 2023).
Associated Press. Juul will pay nearly $440 million to settle states’ investigation into teen vaping. npr. 2022.
Lippert AM. Do Adolescent Smokers Use E-Cigarettes to Help Them Quit? The Sociodemographic Correlates and Cessation Motivations of U.S. Adolescent E-Cigarette Use. Am J Health Promot 2015; 29(6): 374-9.
Boakye E, Osuji N, Erhabor J, et al. Assessment of patterns in e-cigarette use among adults in the US, 2017-2020. JAMA Network Open 2022; 5(7): e2223266-e.
Rotermann M, Gilmour H. Correlates of vaping among adolescents in Canada. Health Rep 2022; 33: 24-35.
Goniewicz ML, Leigh NJ, Gawron M, et al. Dual use of electronic and tobacco cigarettes among adolescents: a cross-sectional study in Poland. Int J Public Health 2016; 61(2): 189-97.
Corsi DJ, Lippert AM. An examination of the shift in school-level clustering of US adolescent electronic cigarette use and its multilevel correlates, 2011-2013. Health Place 2016; 38: 30-8.
Lippert AM, Corsi DJ, Venechuk GE. Schools Influence Adolescent E-Cigarette use, but when? Examining the Interdependent Association between School Context and Teen Vaping over time. J Youth Adolesc 2019; 48(10): 1899-911.
Bostean G, Sanchez L, Lippert AM. Sociodemographic disparities in e-cigarette retail environment: Vape stores and census tract characteristics in Orange County, CA. Health Place 2018; 50: 65-72.
Subramanian SV, Jones K, Duncan C. Multilevel methods for public health research. In: Kawachi I, Berkman LF, eds. Neighborhoods and health. Oxford; New York: Oxford University Press; 2003.
Subramanian S, Glymour MM, Kawachi I. Identifying causal ecologic effects on health: a methodological assessment. In: Galea S, ed. Macrosocial determinants of population health; 2007: 301-31.
Statistics Canada. Canadian Community Health Survey (CCHS): 2007 microdata files user guide. Ottawa, ON: Health Statistics Division, Statistics Canada, 2008.
Wilkins R. Postal code conversion file plus (PCCF+), version 5F: automated geographic coding based on the Statistics Canada Postal Code Conversion files, including postal codes through July 2009. Ottawa, ON: Health Statistics Division, Statistics Canada; 2010.
Statistics Canada. Dictionary, Census of Population, 2016. Ottawa, ON: Catalogue no. 98-301-X., 2017.
Liang CY, Buajitti E, Kornas K, et al. Canadian atlas of premature mortality, 1992-2015: Cross-provincial comparisons. . Toronto, ON: Population Health Analytics Lab, 2020.
Carle AC. Fitting multilevel models in complex survey data with design weights: Recommendations. BMC Med Res Methodol 2009; 9: 49.
Corsi DJ. Distribution of tobacco use in populations: a comparative multilevel and longitudinal analysis of Canada and India; 2012.
Krieger N, Waterman PD, Spasojevic J, Li W, Maduro G, Van Wye G. Public Health Monitoring of Privilege and Deprivation With the Index of Concentration at the Extremes. Am J Public Health 2016; 106(2): 256-63.
Khouja JN, Suddell SF, Peters SE, Taylor AE, Munafo MR. Is e-cigarette use in non-smoking young adults associated with later smoking? A systematic review and meta-analysis. Tob Control 2020; 30(1): 8-15.
Cadham CJ, Liber AC, Sanchez-Romero LM, et al. The actual and anticipated effects of restrictions on flavoured electronic nicotine delivery systems: a scoping review. BMC Public Health 2022; 22(1): 2128.
National Center for Chronic Disease Prevention and Health Promotion (US) Office on Smoking and Health. The Health Consequences of Smoking—50 Years of Progress: A Report of the Surgeon General. Atlanta (GA): Centers for Disease Control and Prevention (US); 2014.
Lee S-I. Developing a bivariate spatial association measure: An integration of Pearson’s r and Moran’s I. Journal of Geographical Systems 2001; 3(4): 369-85.
Guest AM, Lee BA. The social organization of local areas. Urban Affairs Quarterly 1983; 19(2): 217-40.
Chi G, Zhu J. Spatial regression models for the social sciences: SAGE publications; 2019.
Federal and provincial regulations related to e-cigarette use in Canada
Federal
Legislation and date
Legal age for purchase
Sale/purchase restriction
Marketing
Use / Where people can vape
Other regulations
Notes
Provincial - British Columbia
Legislation and date
Legal age for purchase
Sale/purchase restriction
Marketing
Use / Where people can vape
Other regulations
Notes
Provincial - Alberta
Legislation and date
Legal age for purchase
Sale/purchase restriction
Marketing
Use / Where people can vape
Other regulations
Notes
Provincial - Saskatchewan
Legislation and date
(Tobacco Control Act amended in 2019 to include vapour products)
Legal age for purchase
Sale/purchase restriction
Marketing
Use / Where people can vape
Other regulations
Notes
Provincial - Manitoba
Legislation and date
Legal age for purchase
Sale/purchase restriction
Marketing
Use / Where people can vape
Other regulations
Notes
Provincial - Ontario
Legislation and date
Legal age for purchase
Sale/purchase restriction
Marketing
Use / Where people can vape
Other regulations
Notes
Provincial - Quebec
Legislation and date
Legal age for purchase
Sale/purchase restriction
Marketing
Use / Where people can vape
Other regulations
Notes
Provincial - New Brunswick
Legislation and date
Legal age for purchase
Sale/purchase restriction
Marketing
Use / Where people can vape
Other regulations
Notes
Provincial - PEI
Legislation and date
Legal age for purchase
Sale/purchase restriction
Marketing
Use / Where people can vape
Other regulations
Notes
Provincial - Nova Scotia
Legislation and date
Legal age for purchase
Sale/purchase restriction
Marketing
Use / Where people can vape
Other regulations
Notes
Links
Provincial - Newfoundland and Labrador
Legislation and date
Legal age for purchase
Sale/purchase restriction
Marketing
Use / Where people can vape
Other regulations
Notes
Provincial - Yukon
Legislation and date
Legal age for purchase
Sale/purchase restriction
Marketing
Use / Where people can vape
Other regulations
Notes
The Smoke-Free Places Act, implemented in 2008 is no longer in force since March 2020 and was replaced by the above-mentioned Act.
Provincial - North West Territories
Legislation and date
Legal age for purchase
Sale/purchase restriction
Marketing
Use / Where people can vape
Other regulations
Notes
Links
Provincial - Nunavut
Legislation and date
Legal age for purchase
Sale/purchase restriction
Marketing
Use / Where people can vape
Other regulations
Notes
Dr. Daniel Corsi is a Scientist at CHEO Research Institute and an Epidemiologist with BORN Ontario. He is also an Assistant Professor at the University of Ottawa Department of Obstetrics and Gynecology with the School of Epidemiology and Public Health.
As an epidemiologist, Daniel focuses on maternal substance use in pregnancy. His research uses innovative methods to understand the influence of socioeconomic status and substance use on maternal child health.
Daniel received his Ph.D. in Population and Public Health in 2012 from McMaster University and completed his postdoctoral training at the Harvard Center for Population and Development Studies in 2014. He is currently the principal investigator on a CIHR-funded project exploring the long-term development of children prenatally exposed to cannabis.
In this field of research, Daniel’s scholarly contributions include over $2.4M in CIHR funding as a principal investigator, 130 peer-reviewed articles, and mentoring more thant thirty scholars, from graduates to postdoctoral fellows.
Dr. Adam Lippert is an Associate Professor of Sociology at the University of Colorado in Denver and an affiliated scientist at the Colorado Population Center in Boulder.
As a demographer and sociologist, Adam focuses on research related to population health disparities and the community-mediated causes of poor health.
He received his Ph.D. in Demography and Sociology in 2013 from Pennsylvania State University and completed his postdoctoral training at the Harvard Center for Population and Development Studies in 2015. Adam researches the relationship between behavioral health and community socioeconomic hardships, using statistical methods to identify disproportionately impacted locales and policies to restore health equity. His research contributions include over thirty scientific publications and a grant portfolio exceeding $350,000.
Outside of academia, Adam’s research insights have influenced health policy in the United States, including the guidance outlined by the Food and Drug Administration and the US Surgeon General on nicotine regulations.
As a professor, Adam teaches courses in demographic techniques, health disparities, and quantitative methods.